Turn off the ‘Bypass system dialogs’ flag (shouldn’t be necessary now)
Turn off filled rendering
The last one is a huge performance boost on most systems, especially if your files are at all complicated.
After doing those and trying it, if it’s still freezing, I would also try turning off the automatic check for updates, as that will go to the network and try to contact the update server. It should do this immediately on startup, and not interfere with the UI (it’s on another thread) but there are moments where it blocks the UI to process a result.
I honestly don’t know what to tell you. If I had your computer sitting here in front of me with development software on it, and could catch it while it’s frozen I might be able to figure out which part of the system is freezing, which would give me a clue as to why. Without that, it’s next to impossible - You’re the only user reporting anything like this.
Is it only happening on this computer, or more than one?
If you have Microsoft Developer Studio installed for C/C++ I could walk you through attaching the debugger to the running process when it freezes, and then getting me the info for the threads.
With debugging running and attached to Lightburn process I was able to manipulate with input for 23 minutes until freeze. but I don’t know how to capture the problem.
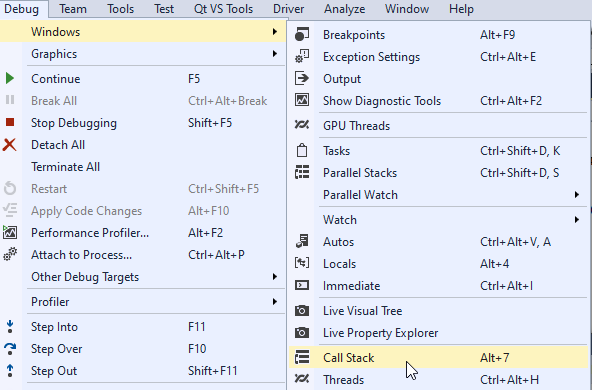
In Visual Studio, go to Debug, then ‘Attach to Process’, select LightBurn from the list and click ‘Attach’. Then go to Debug > Break All to interrupt the app and enter the debugger.
There will be two debugging panes of interest: Threads and Call Stack:
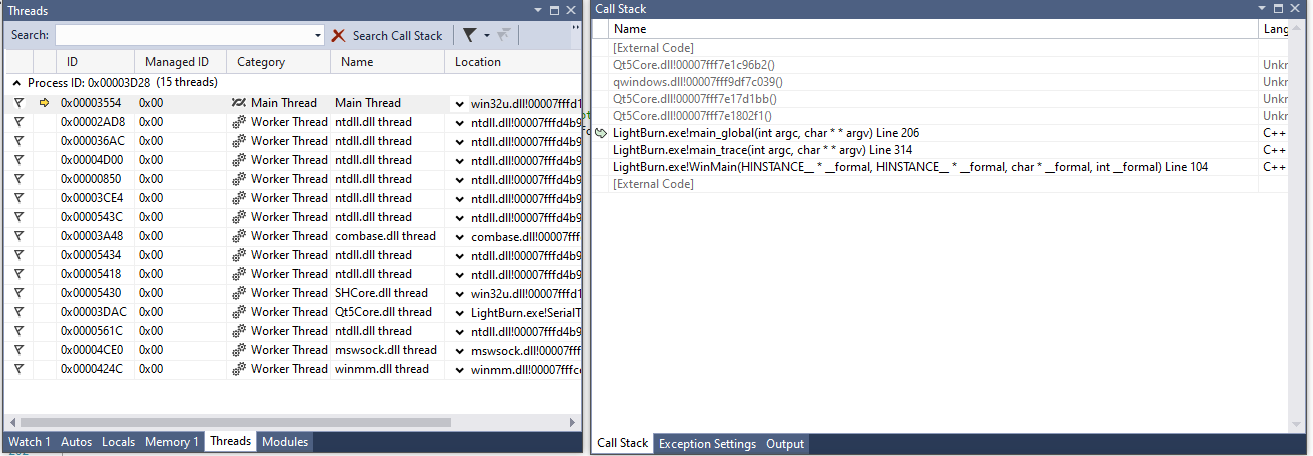
With those windows open, if you double-click an entry in the ‘Threads’ list, you should see some visible text in the ‘Call Stack’ window, like this:
Any of the threads that just say “[External Code]” in the call stack aren’t interesting, but any that show content you can post screen shots here or email to support at lightburnsoftware.