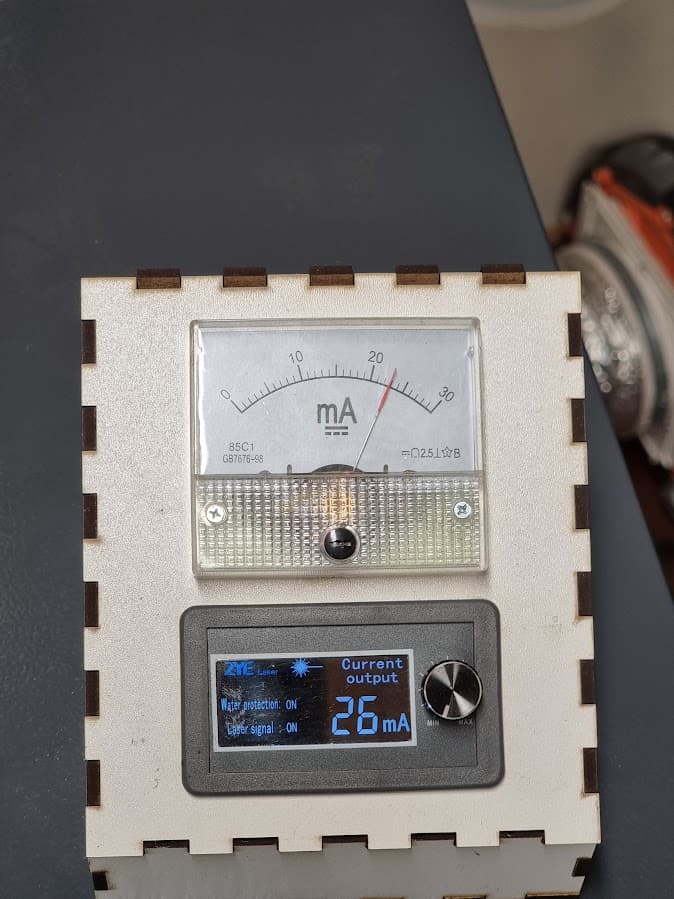
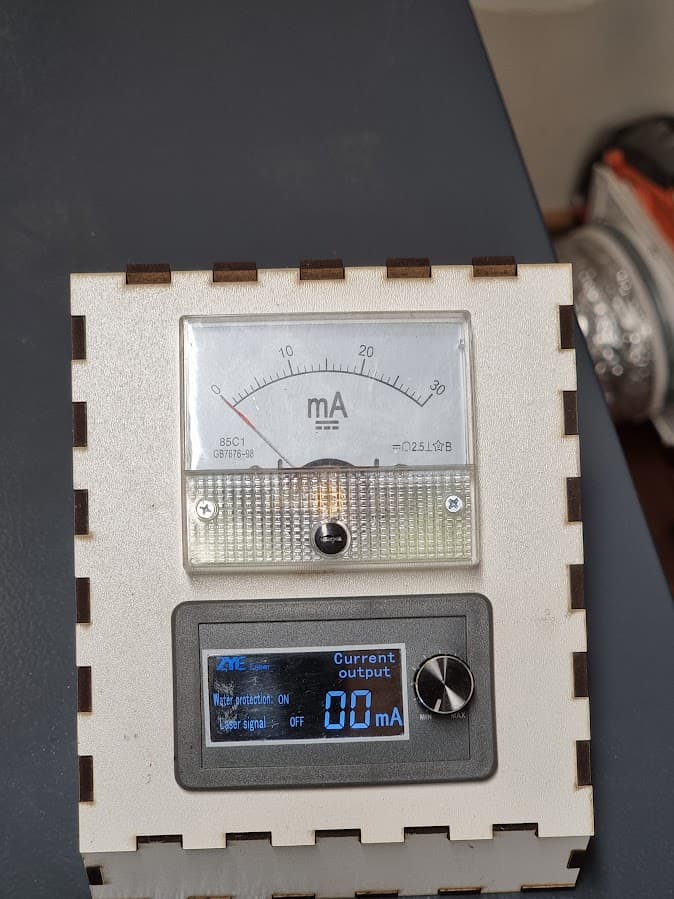
The legend in the bottom right of the analog meter says it’s (allegedly) 2.5% accuracy at full scale = ±0.75 mA. You could calibrate it more accurately with a known DC current.
The digital meter samples the current with a 100 Ω resistor in the HV power supply that’s probably 1% tolerance = ±0.3 mA.
In round numbers, those tolerance could account for 1 mA of the difference. I would lay some money that the analog meter isn’t nearly as accurate as it claims, but I admit to considerable bias.
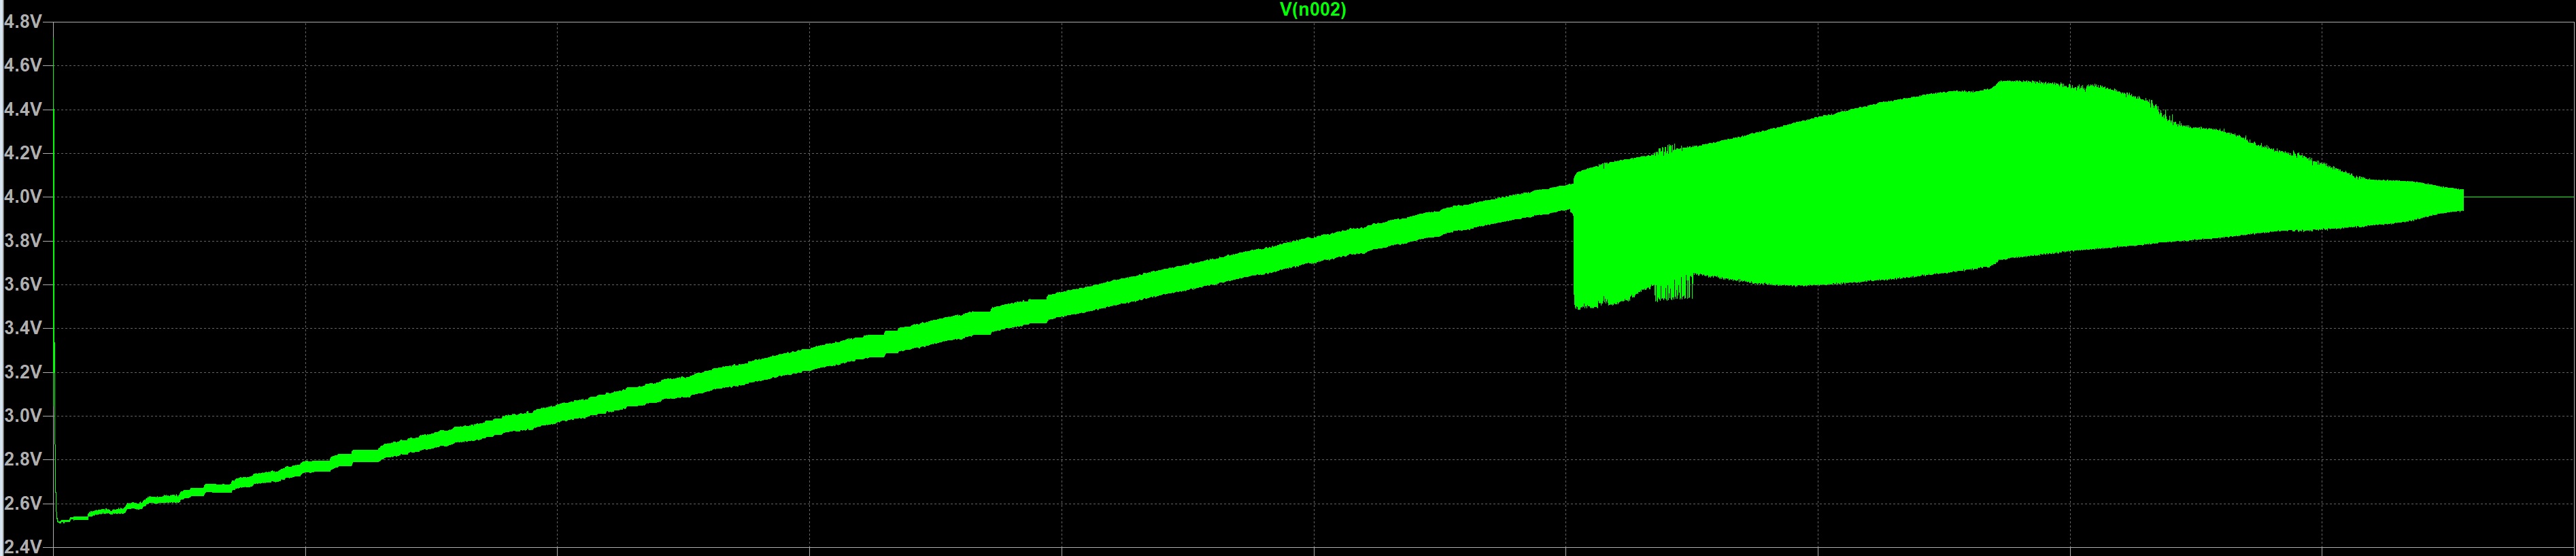
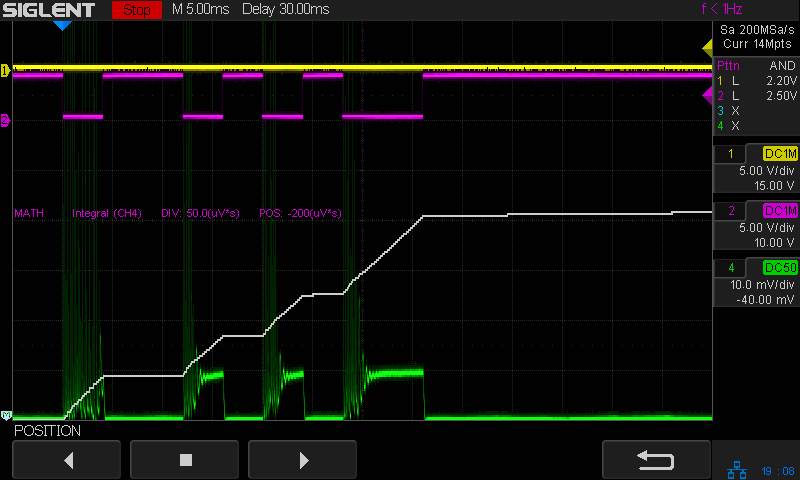
The actual cause is likely the non-DC nature of the current waveform. Here’s what an 80% PWM pulse looks like:
The analog meter expects to measure a constant DC current, so it will not respond correctly for pulse measurements and will definitely have trouble with the oscillations at the start of the pulse.
The digital meter may have similar problems, but should have a front end filter to remove the high-frequency hash.
Longer pulses, on the order of seconds, will give better readings, because both meters have time to settle down with a more DC-ish current.
Bottom line: either one is close enough. I’d favor the digital meter’s reading for long pulses.
Wisely is it written: A man with one clock knows the time and a man with two clocks is never sure.
No meter is shipped with a maximum error label, so those %'s are averages. Analog meters do not have exactly linear movements… Digital meters sample values over time, so accuracy depends on the internal timer accuracy and are typically specified as the number of digits accuracy.
@ednisley said it best, and that 1-liner applies to any measurement device.
Choosing the digital as your reference is correct. On a 2 ot 3 digit display, accuracy is typically specified as +/- 1/2 digit regardless of the reading. That means the “26” can be anywhere from 25.5 to 26.5 mA.
See how they compare at 50% PWM on a similar cut. They should read half their value at 99% PWM, give or take, because the tube current has no trace of the 20 kHz PWM carrier.
The current is relatively constant and flat after the first 3 ms. There is no PWM.
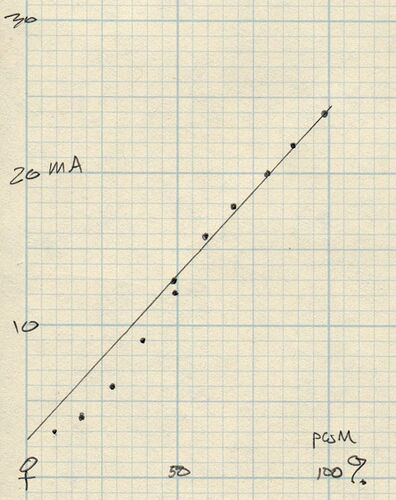
The relation power setting/real power is not linear, due to the low pass filtering in the PS. So the method from the last post doesn’t work.
Put a trusty multimeter in series with the analog meter to find its accuracy.
For the digital meter, measure the voltage between the 3rd and the 6th pin (from the left) of the RJ45 connector. This is the voltage across the 100Ohms resistor in the return line of the laser tube. This voltage is used by the digital meter.
That’s not the case for me and on the SarbarMultimedia youtube channel you find measurements, which aren’t neither. Your measurements would easily allow two different linear fits and most likely a polynomial fit with better Chi square.
There are several reasons why it’s not linear:
The first is the mentioned low pass filter used to convert the PWM to a constant voltage. The response looks like this for my PS and a 20kHz signal (note the offset):
The x-axis shows the PWM duty cycle from 0 to 100% and y is the input to the comparator of the controller IC.
The controller of the PS regulates against the power into the transformers and not the current (ignoring switching losses). All non linerarities of the corresponding signal processing are added here (there is yet another low pass filter),
Finally the relation current to output power of the tube is non linear, since it has a pedestal and saturates at some point.
Some of these effects might compensate each other to some extend. This is, however, not sufficiently precise to test or tune a meter.
(This tab got lost during a family trip; sorry for the long delay.)
Looks like a LTSpice simulation of the circuit, which is certainly less hazardous than poking around inside!
The laser tube cathode lead goes through a 100 Ω resistor to common, with the 1 V/10 mA signal swimming into a pond of SMD parts around the TL474 PWM controller driving the transformers. I assumed they closed the loop with the tube current, without actually tracing out the circuitry.
I haven’t been able to find any schematics for the HV supplies found in contemporary non-K40 lasers. Do you have any pointers?
The gnarly part of that plot came from using the scope’s RMS calculation for the spiky current at low PWM values, but with some of those pulses going off-screen. A bit later on, I had the scope calculate the integral of the current with better scaling and got a surprisingly pretty result:
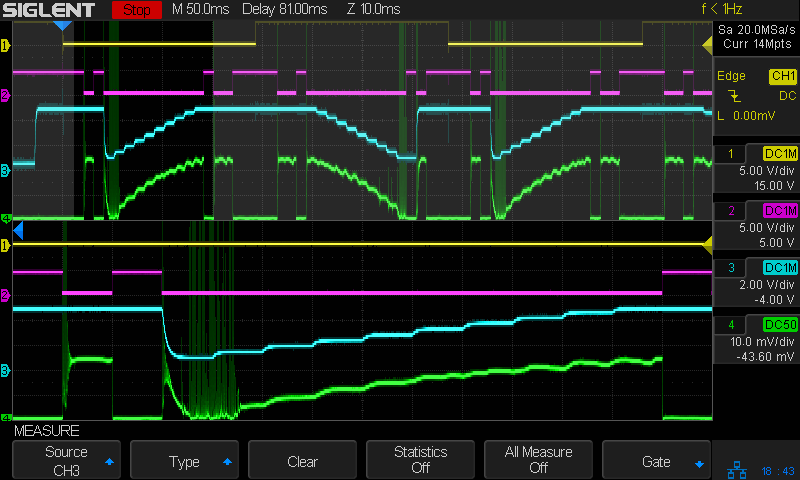
If I understand what you’re describing, the tube current is not in the control loop, with the supply regulation using the input power to the transformer. That would help explain the compression at the high end of the power scale:
That was using the controller’s analog output (cyan) with a bar test pattern from 0% to 99%, with the current (green) definitely getting squashed on the high end.
As far as power meters go, they gloss over pretty nearly all of that mess!
The higher power PSs are not much different. My 60Watt supply has two HV transformers in series and my 150W supply 3 complete HV drivers in parallel for primary and series for the secondary.
Otherwise the principle is the same.
The 100Ohms resistor connects to ground and only serves for current reading and to make the system much more dangerous (now the current can flow through your body - without you just get charged - bird on the HV line effect).
I’m not sure I understand your point about the mean current. Would you have expected a different result?
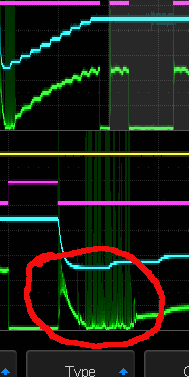
I think this is a great shot of the tube in a bad zone of operation… You see it in all of these, but never seen it for such a long duration…
Do you have any idea what the peak current that is occurring here? Is that something that you scope can catch and give us some values… none of my stuff is sensitive enough.
Seems like the same thing occurs a minimum pwm on the above set of traces
I think he’s referring to the average current… Just like a voltmeter will read 2.5 volts on a 5V ttl pwm signal… but we know the operating voltage is actually 5V… It’s only at 5V for 1/2 the time…
I’ve seen that part, but can’t seem to find anymore of it… Am I not driving the site correctly? I’d like to see how the tl494 is wired up… and a few other things…
At the bottom of the screen, you will find buttons that direct you to other schematics. If you’re specifically interested in a PWM controller, that’s the one you should look for.
I have been diligently investigating the startup behavior for several weeks now and have started documenting my findings. Once I have completed my work, I will publish it here. In short it is now a common understanding, that the startup of a long tube is considerably more intricate than a Townsend discharge. A way to confirm this is by wrapping the tube in grounded aluminum foil, which noticeably slows down the startup process. Such an effect would not be observed in a Townsend discharge.
For a comprehensive overview, I recommend referring to this paper.
Based on my current observations, it appears that the power supply (PS) might struggle to deliver sufficient current during the ionization wave, resulting in an inability to maintain ionization.
Yes, I found them… for some reason this didn’t work before or when I previously read it… I even asked one of the guys about it and he advised to click on the tab…
Worked this time… these things never cease to amaze me…
Thanks for posting the link again… I tried to find this and amend the comment, but it was lost in Discourse somewhere…
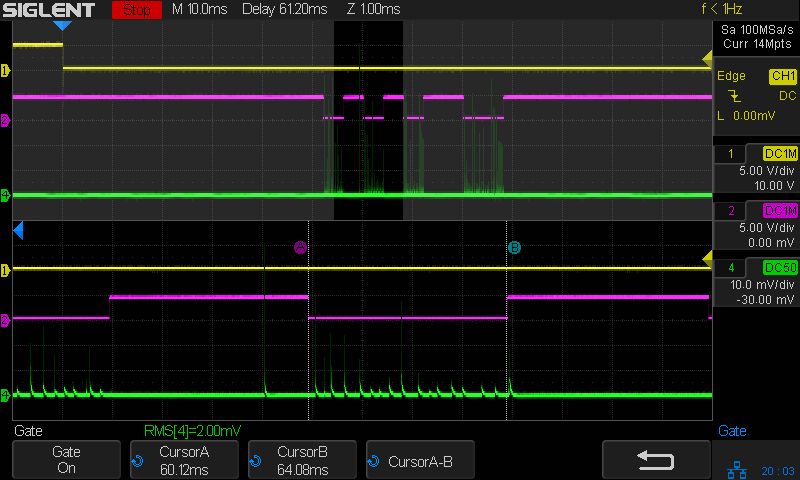
(The other traces in that post have different current scales, as given in the captions. Mostly, I use 10 mA/div to see the details during the pulse while ignoring the absurdly high peaks.)
The highest spike occurs during the glitch just left of center in the lower (zoomed) view, while LON is high = laser should not fire. It’s a bit over 600 mA tall.
The minor spikes while LON is low have peaks around 400 mA and seem typical of the behavior during low-PWM tube activity. This was at 20% PWM.
That’s where I’d started a while ago, but there seemed little correlation between those and the parts around the TL474. Lacking the motivation to figure out exactly what was going on in there, it seems I made the wrong assumption about that convenient 100 Ω resistor; it may just be there for the digital current meters installed in some of the supplies.
If the controller closes the loop with the input power to the transformers, that might explain the spikes at low currents: the tube fires intermittently while supply holds the voltage just above the ignition point and doesn’t get much error signal to work with.
Thanks for the link to that paper, although it’ll take a while to plow through it!
If you post a photo of your PS PCB, I would most likely be able to determine if it is the standard schema and identify the locations of the interesting signals.
Never seen anything on how the lps current/control option that plugs into the lps via a Ethernet type connect actually works inside…
Pretty amazing current spikes… I think the voltage climbs, the tube conducts, current limit causes the voltage to drop and the tube stops lasing… when the voltage recovers it starts to lase and the current, again drops the voltage below lase excitation levels… I think this is where you don’t want your tube for any extended time period…
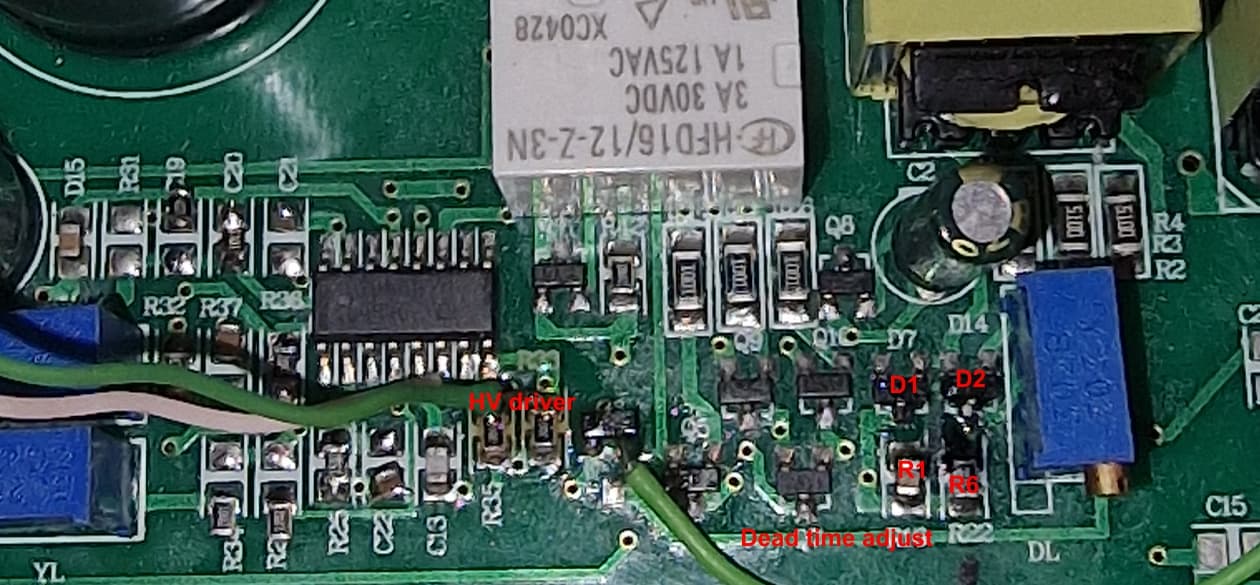
These PSs are indeed mostly consistent with the schematics. I happen to have the same power supply (PS) and I am sharing a picture of my PCB below, highlighting the corresponding signals and component names as used in the K40 schematics. (Please disregard my modifications. I’m experimenting with the current as feedback.)
The HV driver refers to the signals on pins 8 and 11 of the TL494. These signals are responsible for driving the high voltage (HV) through pulse-width modulation (PWM).
The Dead time adjust signal corresponds to the energy delivered to the HV driver and serves as feedback for the TL494.
D1 and D2 represent the raw signal obtained from the current sense transformer. Monitoring these signals allows you to assess if your HV stage is in resonance.
Additionally, the upper left trimmer on the PCB enables slight adjustments to the frequency of the PWM driver signal. This adjustment was likely incorporated in the initial design to align with the resonance frequency.