Simple, yet game-changing! Grade the response of your material and method first!
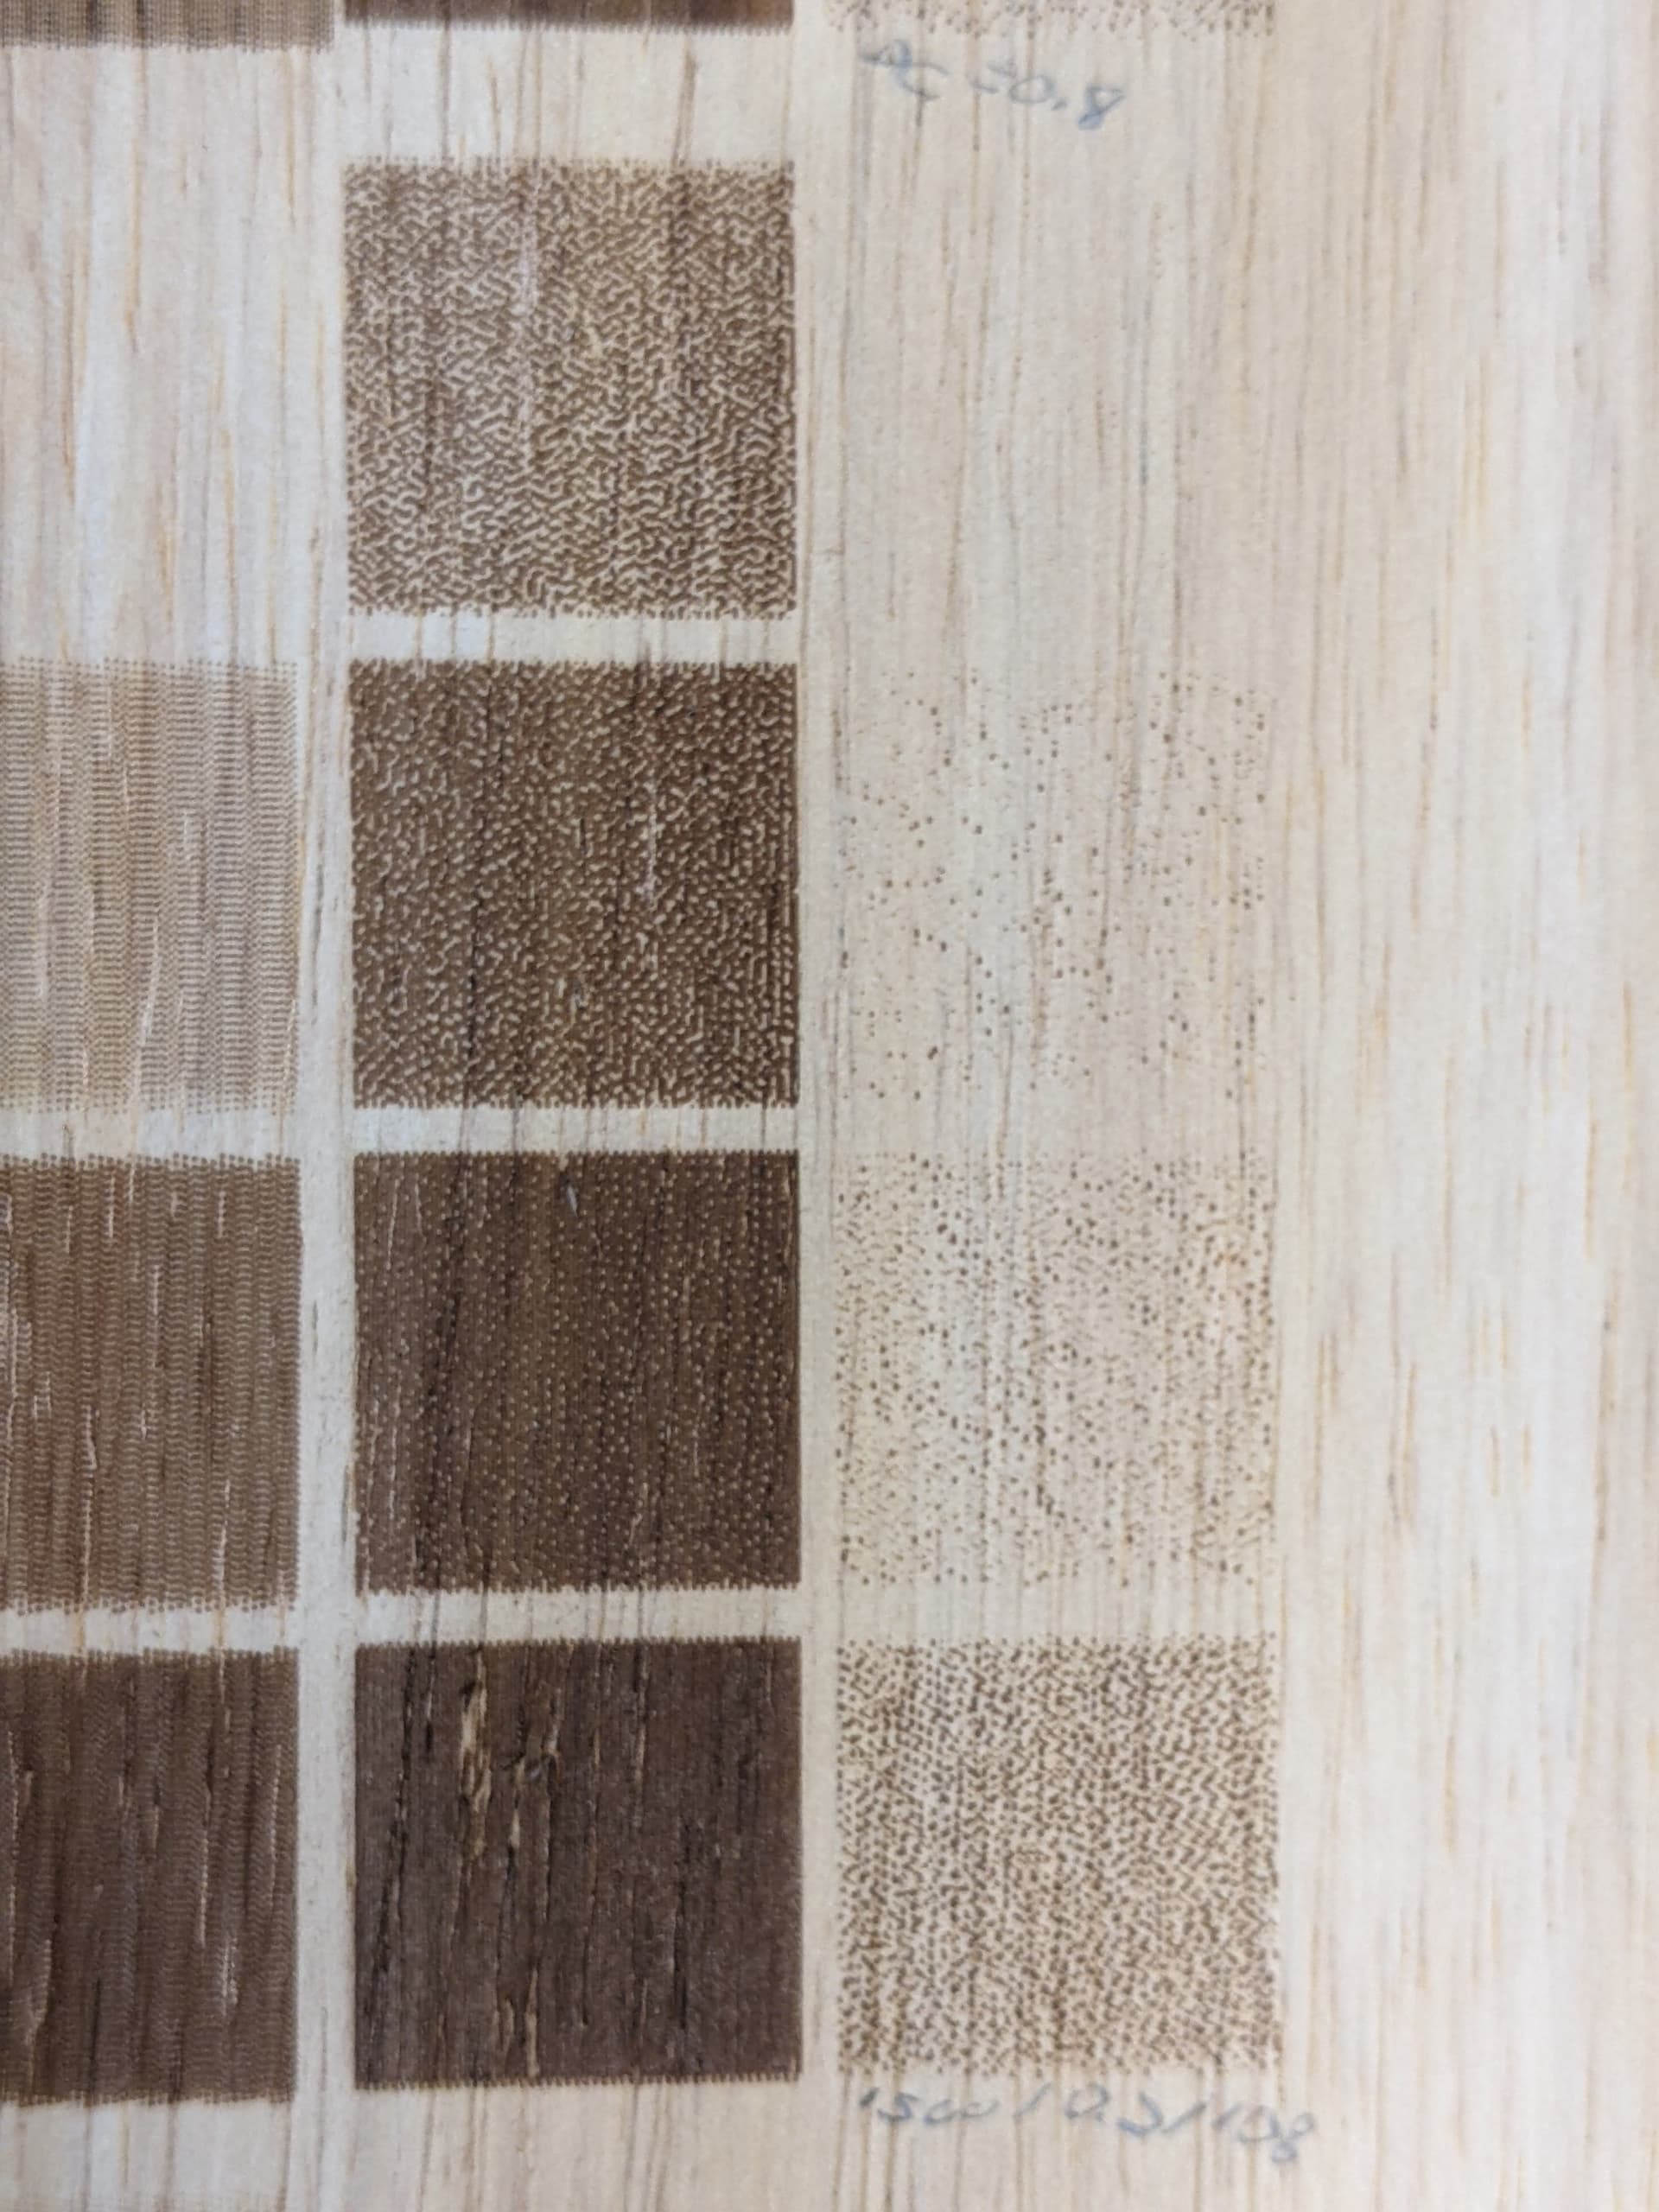
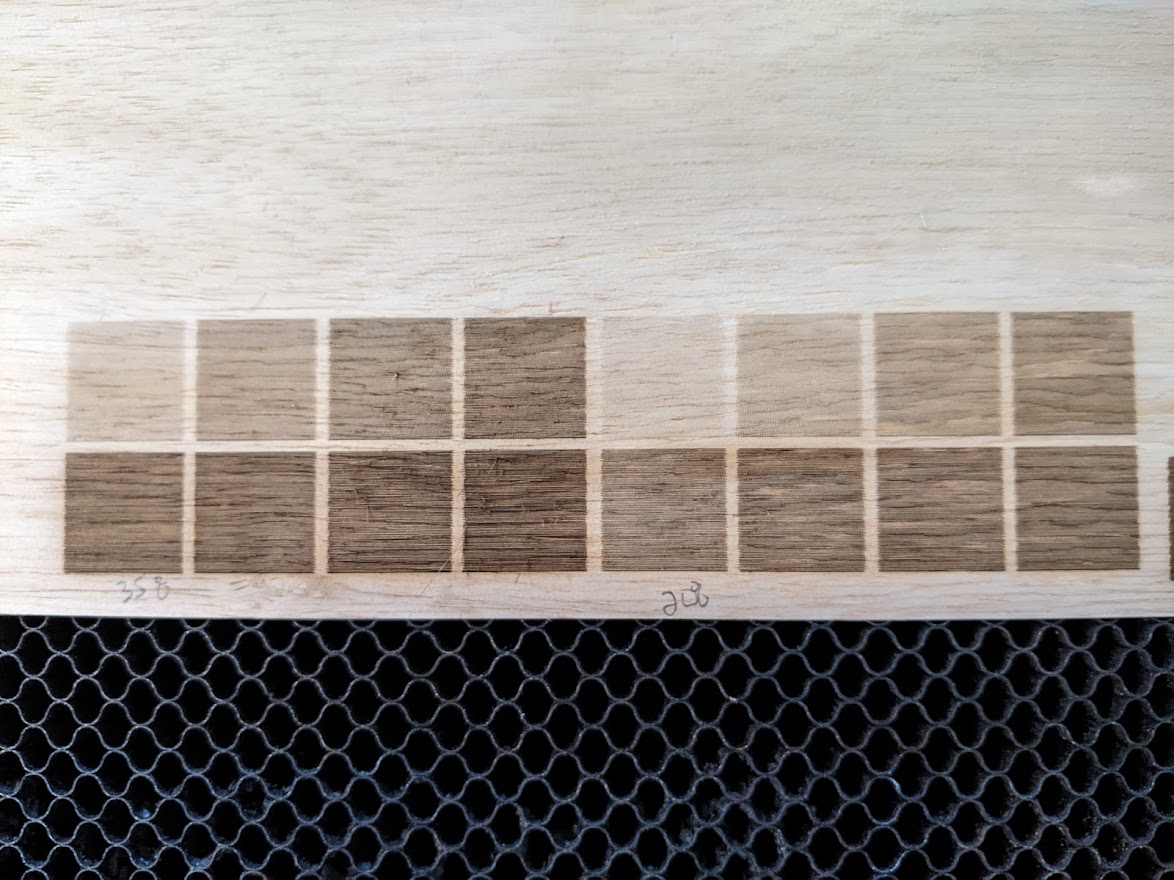
A set of simple 00,1f,3f,5f,7f,9f,bf,df,ff squares. 00 is of course unburnt and can be anywhere. The squares must be large enough to encompass enough dithering points to average. On wood, the squares must be large enough to cover an average of dark and light grain areas.
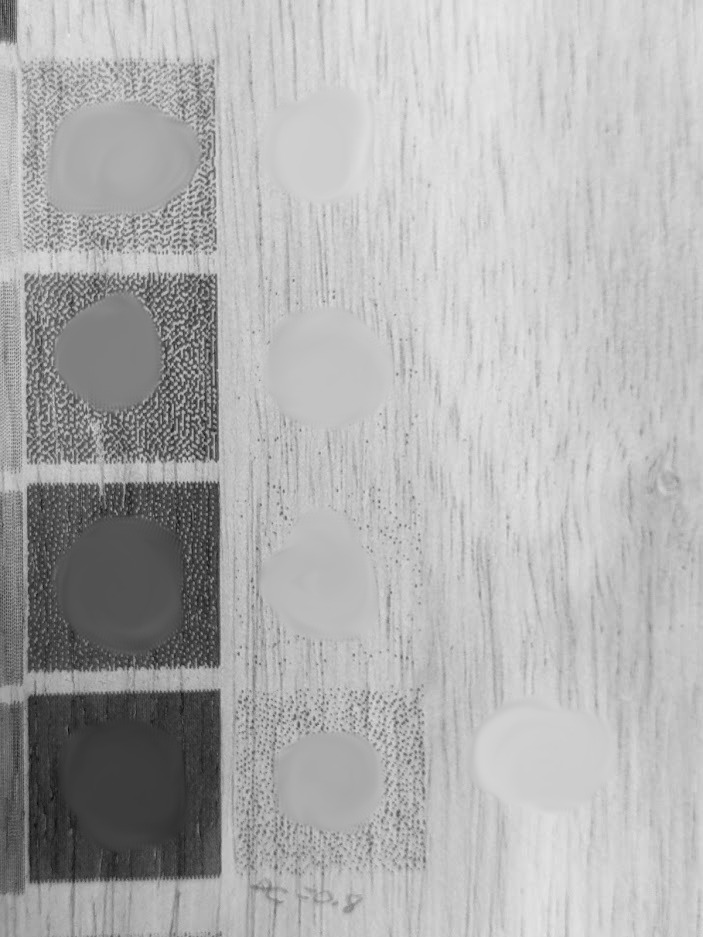
Bring into Gimp, turn to grayscale mode, then Smudge the center of each square to get a general tone.
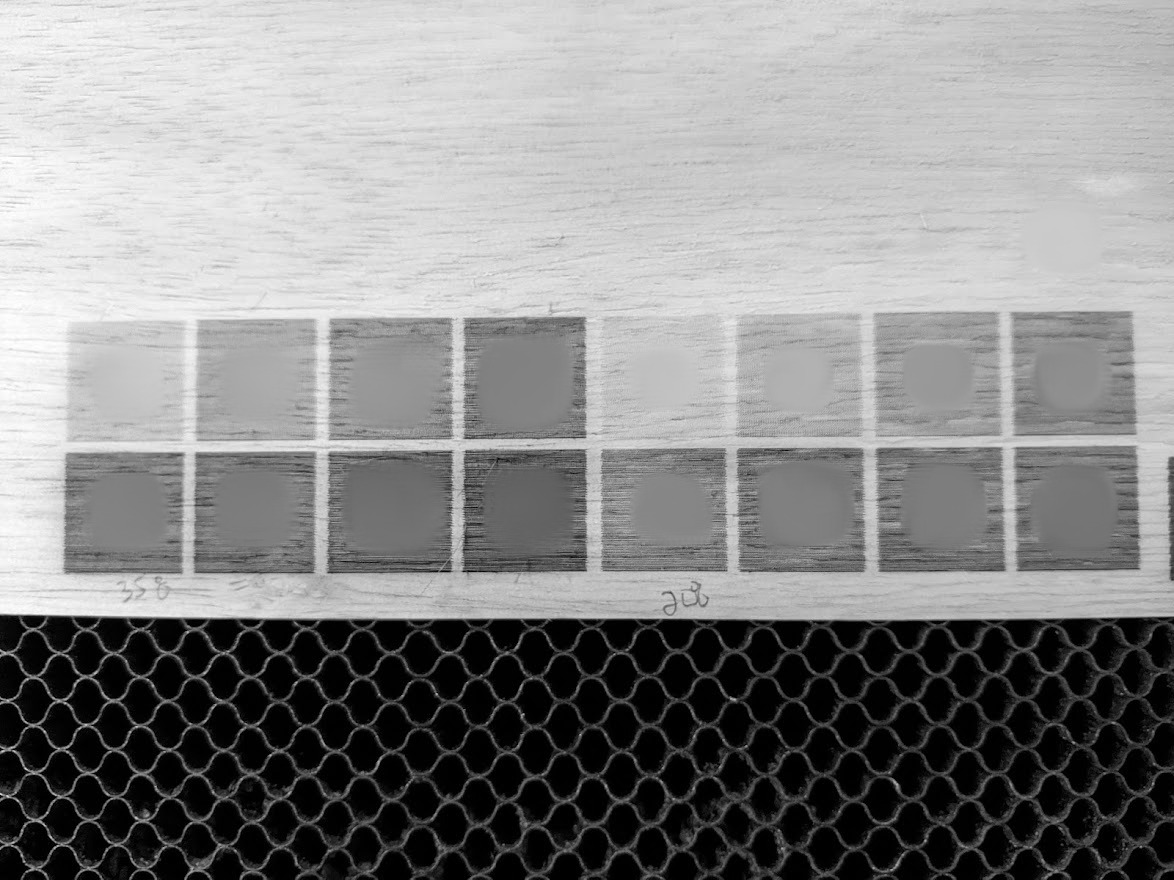
(note- smearing and sample taken of unburned 00 spot in top right)
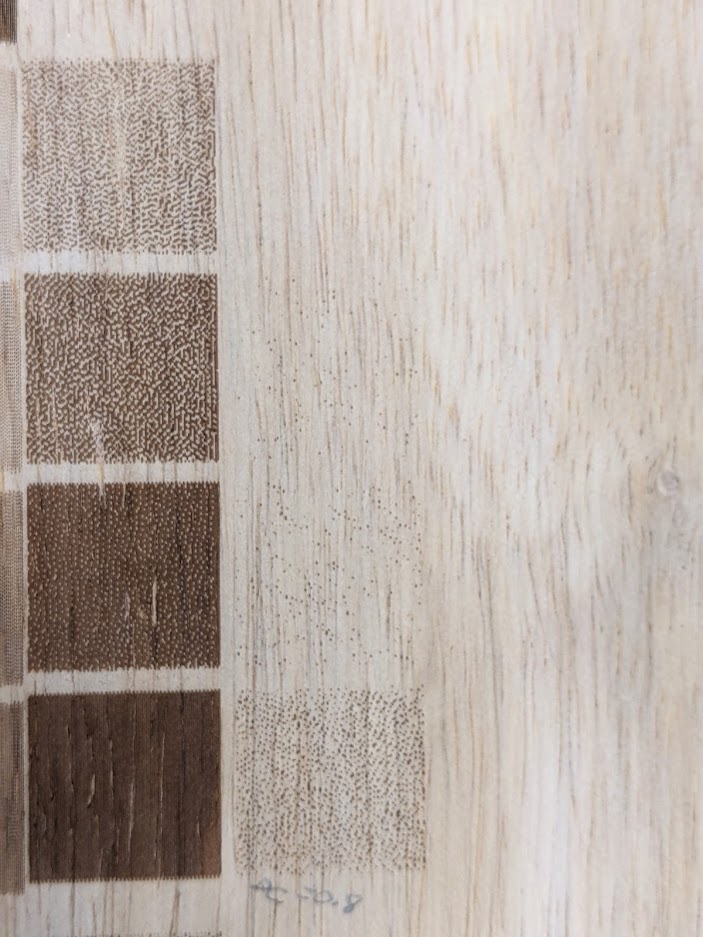
Use Color Picker to get the numeric shade after each burn. We don’t actually need or care that low isn’t 00 and high isn’t ff. We just take the 00 and ff endpoints, find what we actually got, and then look for linearity between them. This is taken as one photo, so lighting and the camera’s auto settings won’t change anything because it affects all the samples. Actually two entirely different settings being tested here (left and right), I’m using the one on the left. I did turn off auto HDR in my phone camera settings, not sure if necessary but seems like a good idea to not use HDR.
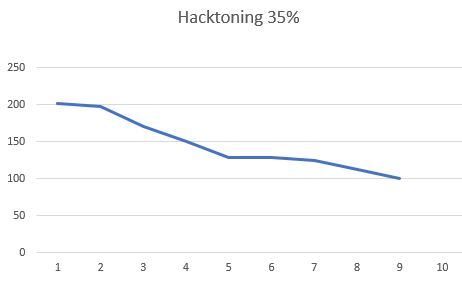
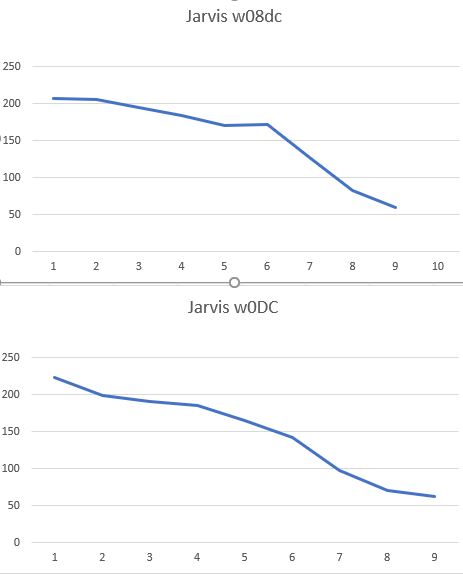
Enter into Excel so you can make a chart.
For a 35% hacktoning burn, I can see at a glance I get PRETTY GOOD toning. 202, 198,171,150,129 (ok weirdly stalled here),129, 125, 112,100.
High and low points are 100 to 202, so “ideal” would be 202,189.25,176.5,163.75,151,138.25,125.5,112.75,100
This could be used to create a compensation lookup table, stored with the Library settings for a particular material. It would replace the “dot width correction” too. It would make a lot of sense to have OpenCV find the features, blur, sample, and get a table.