How to calibrate TCON/TCOFF for galvos (BJJCZ)

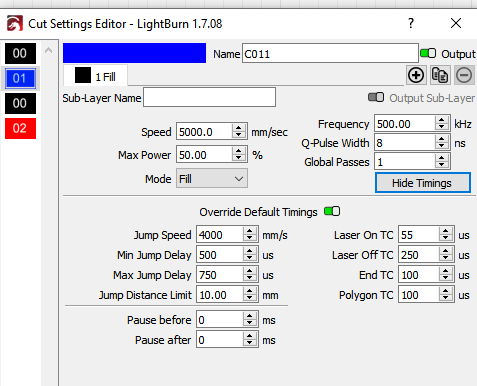
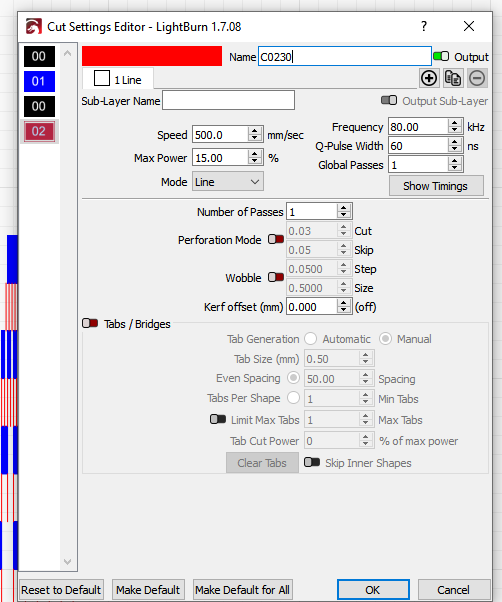
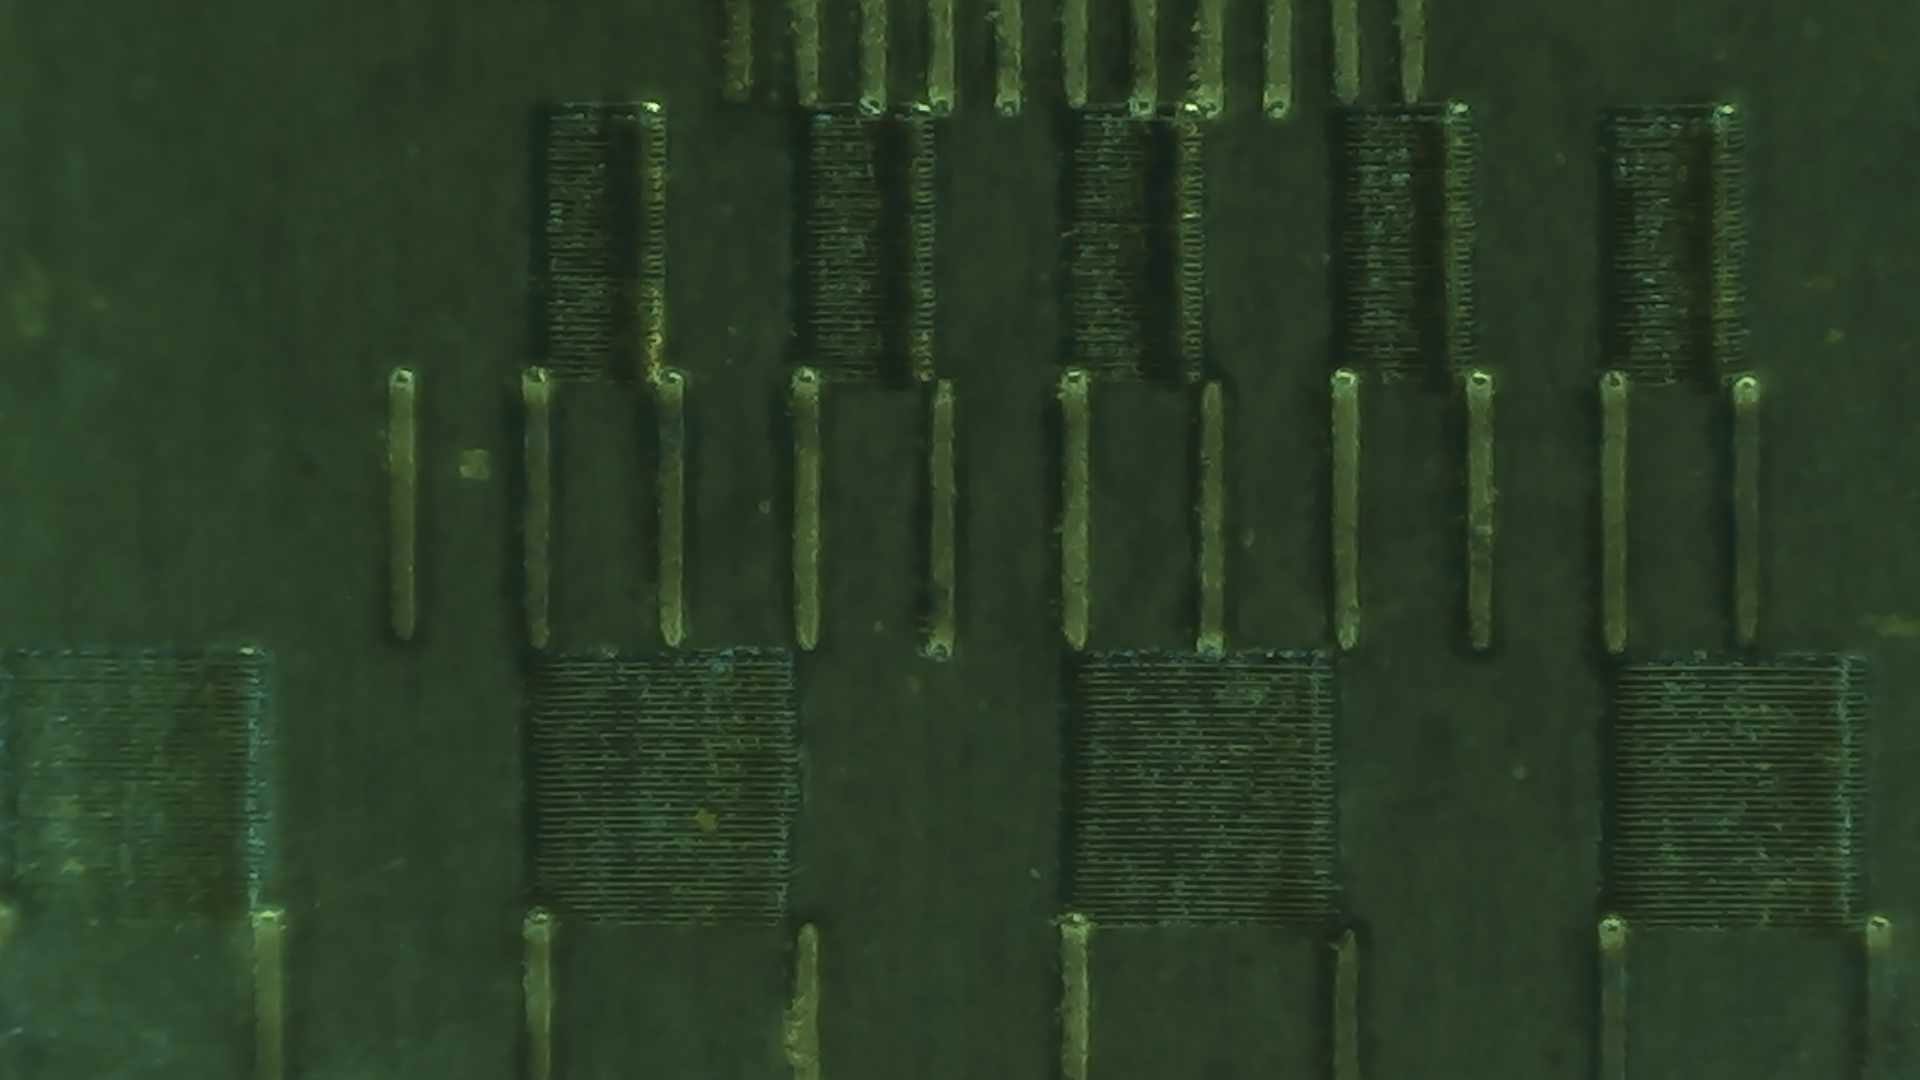
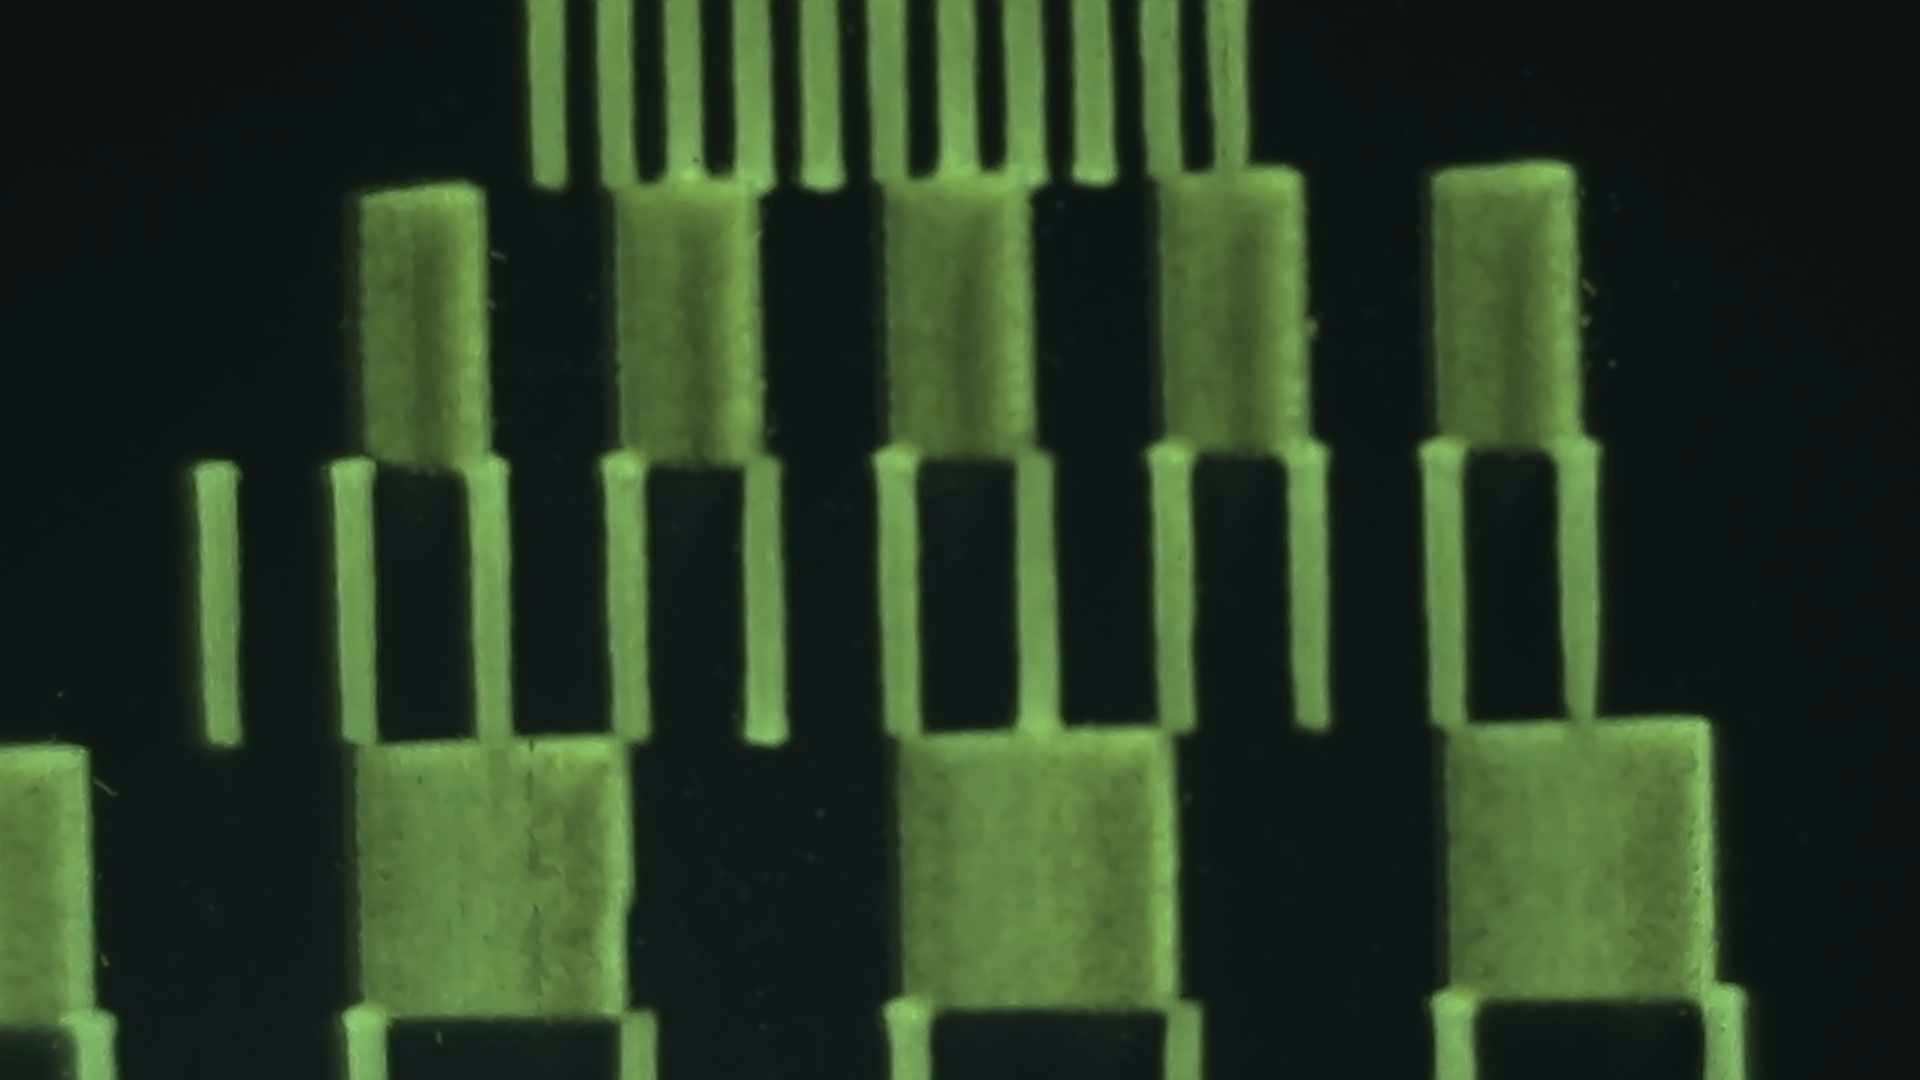
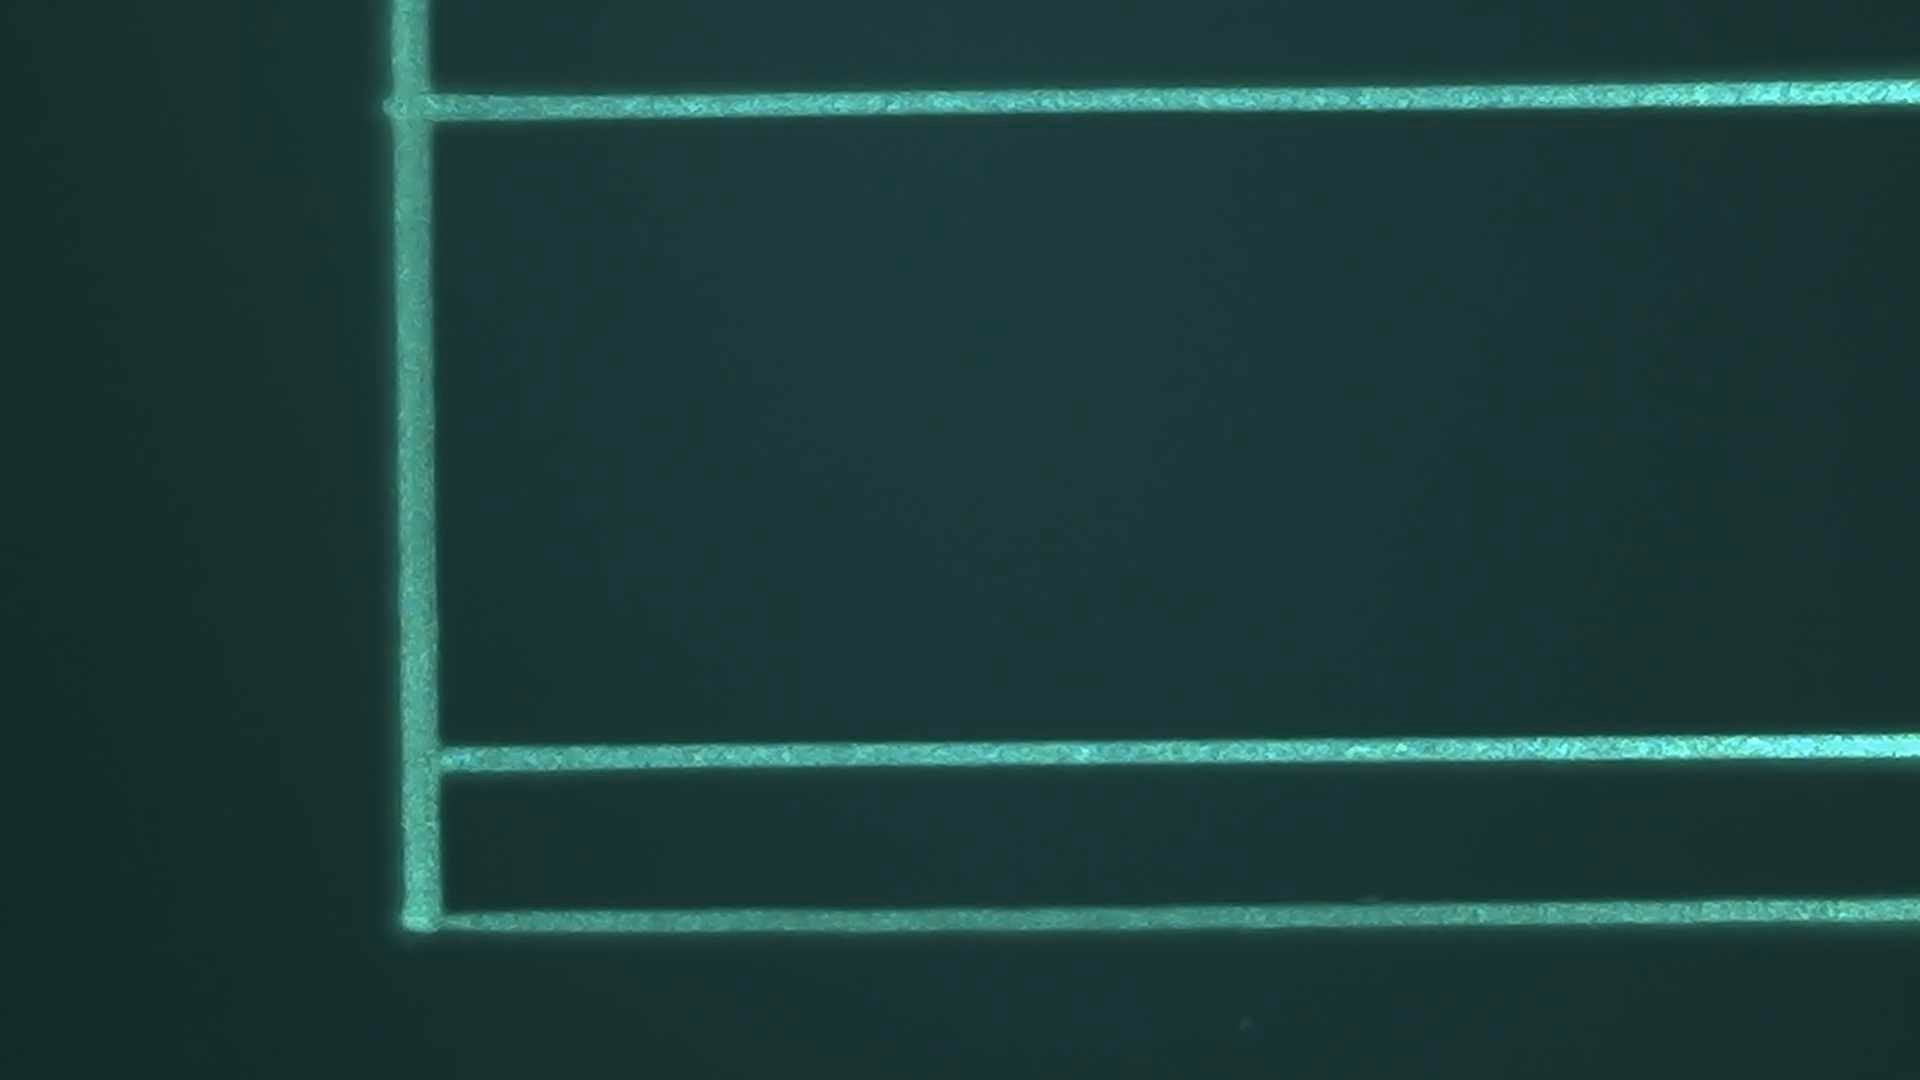
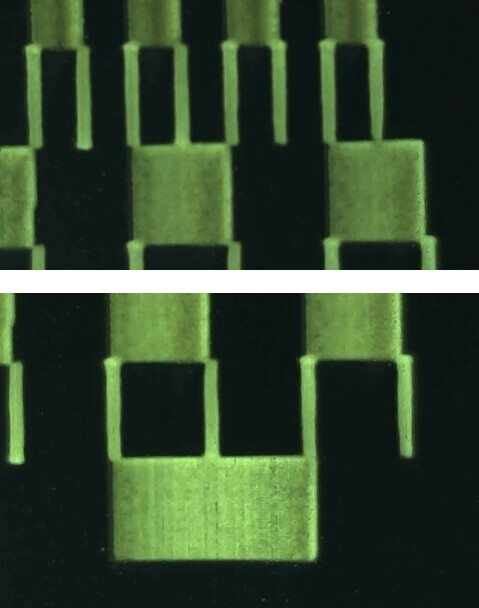
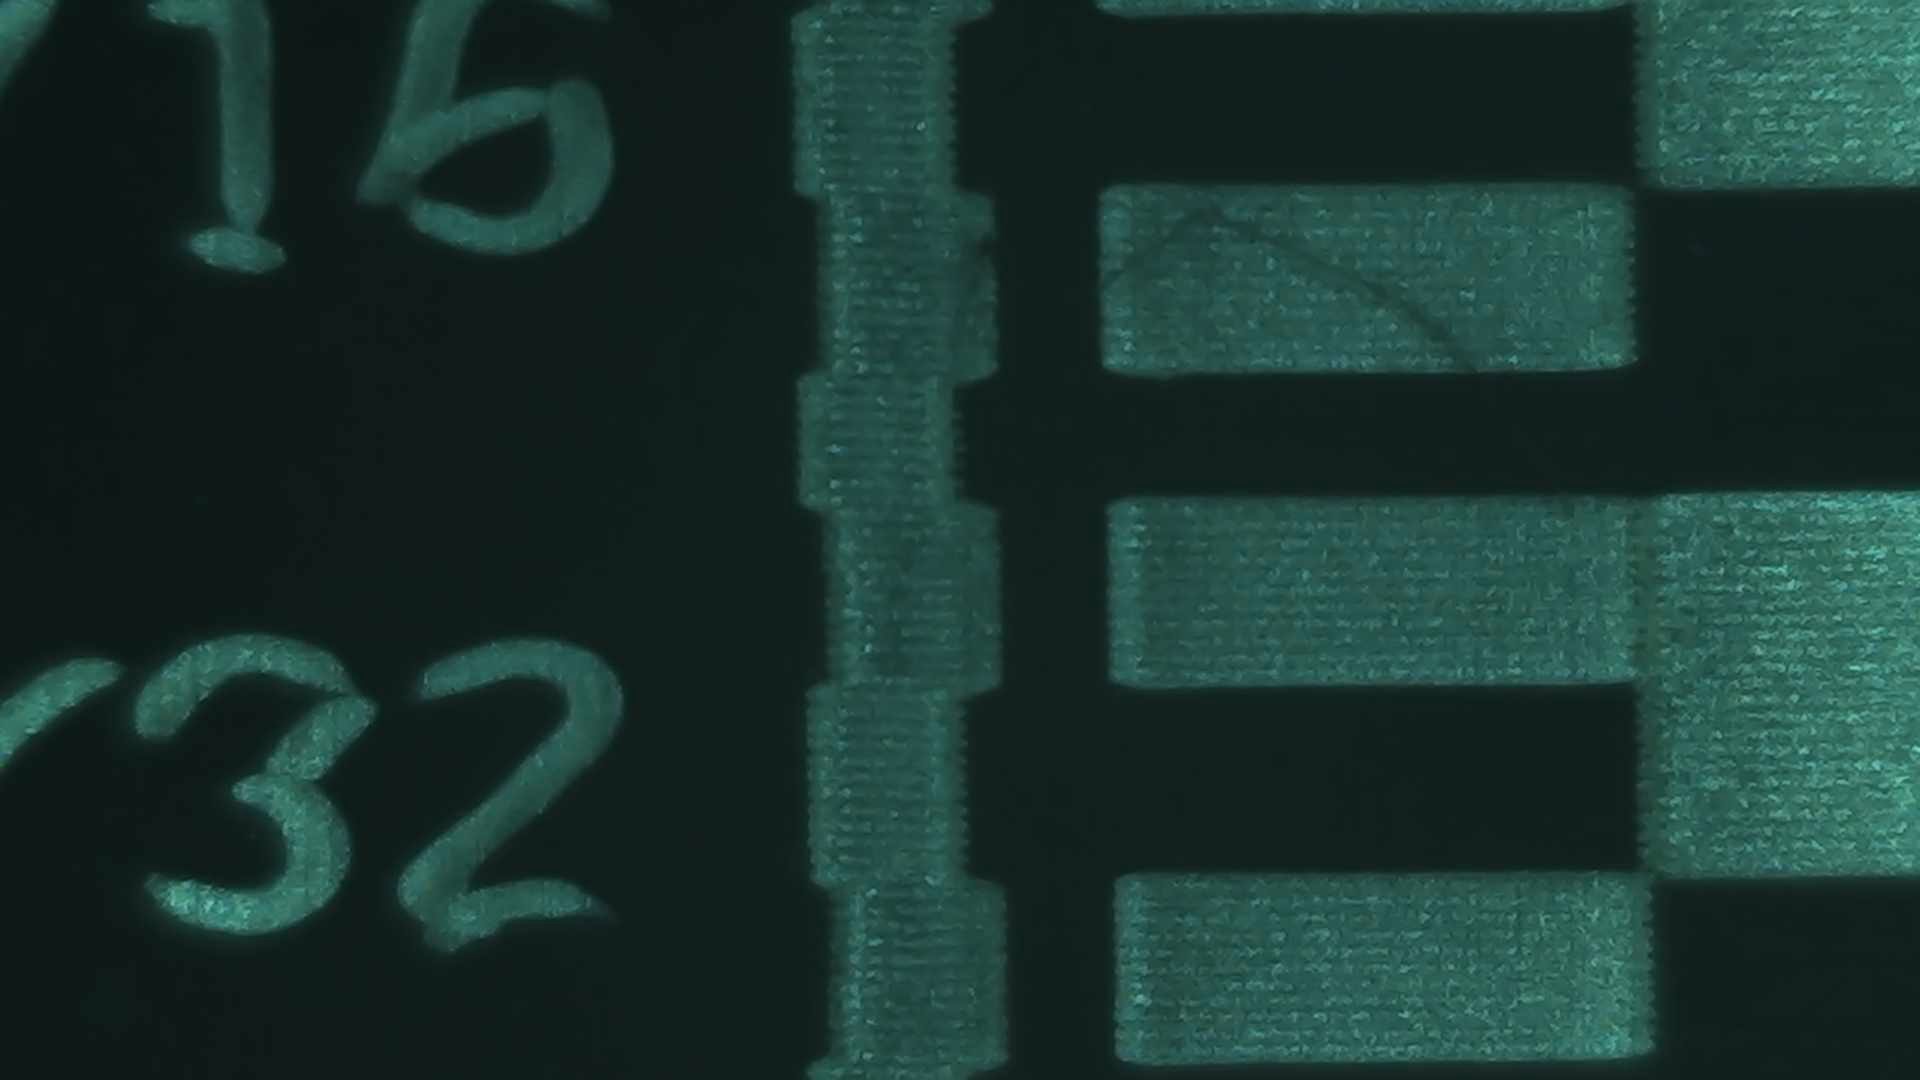
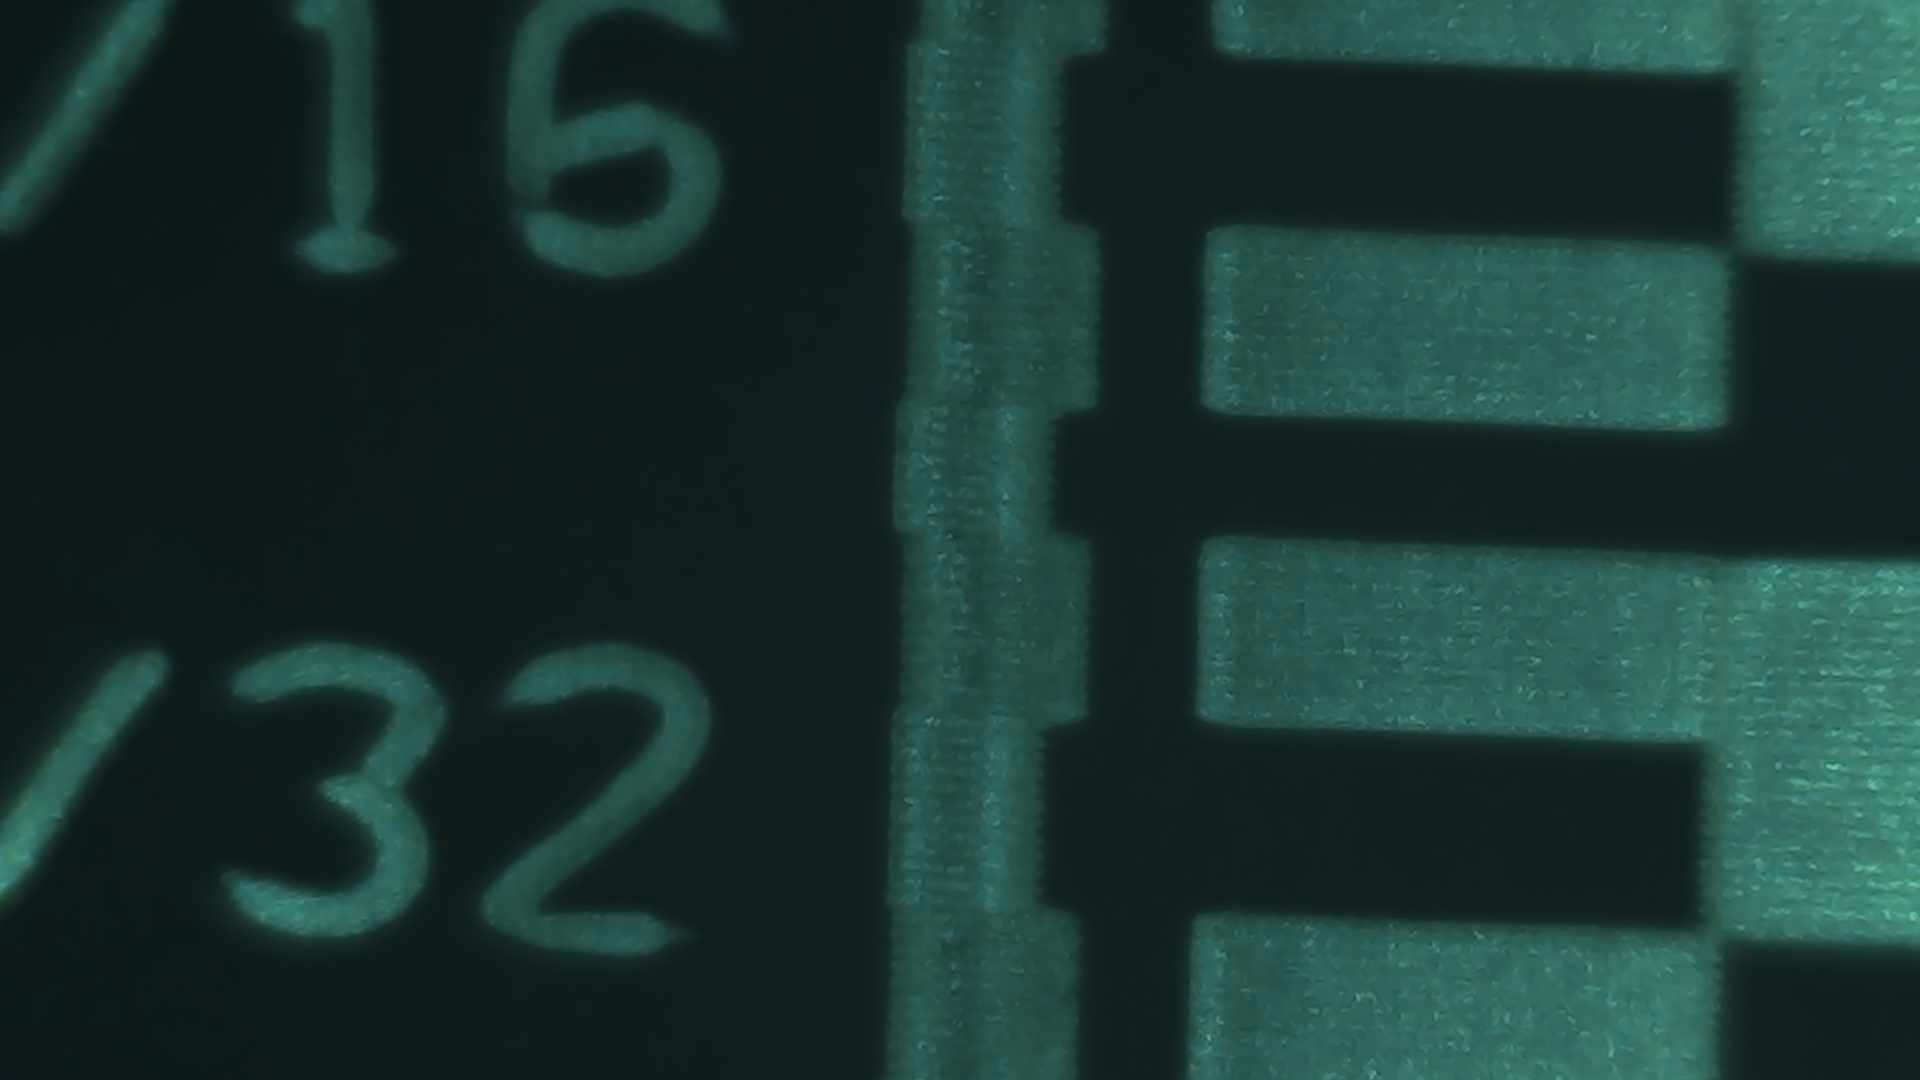
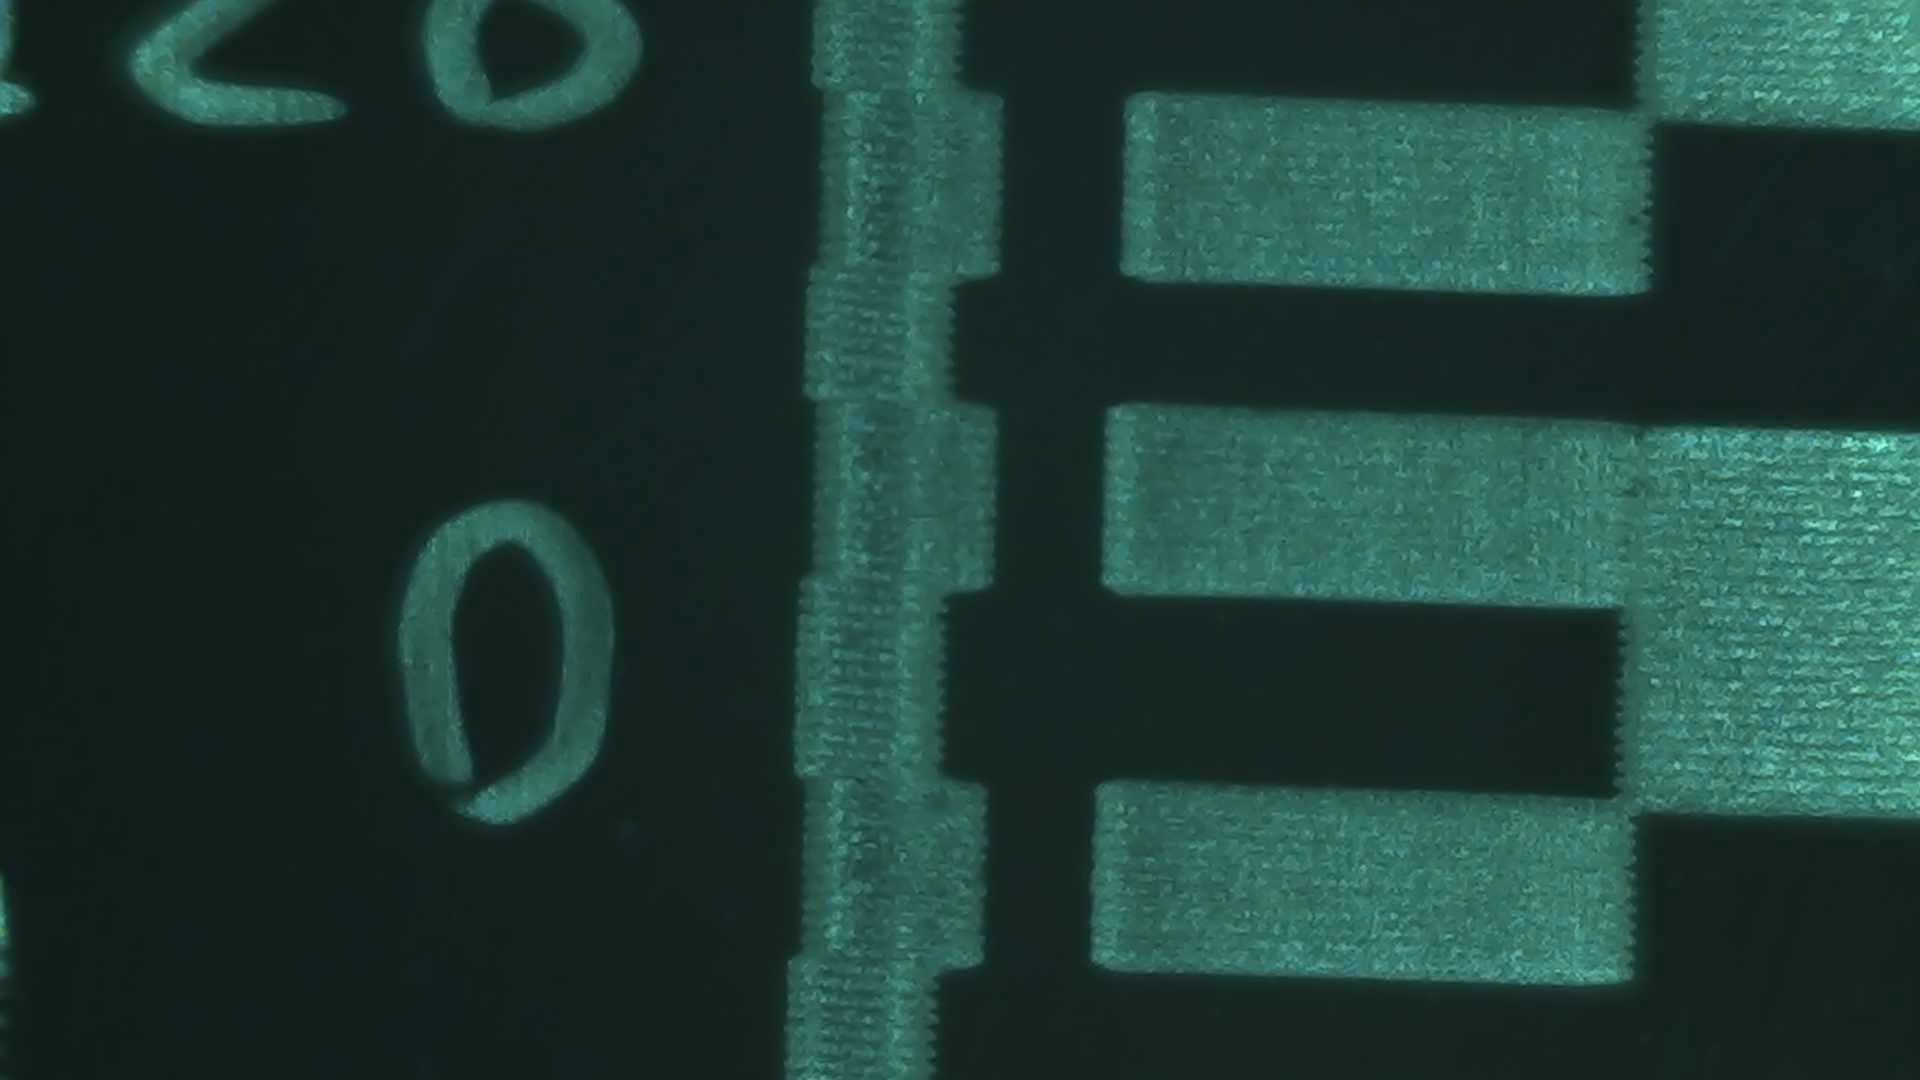
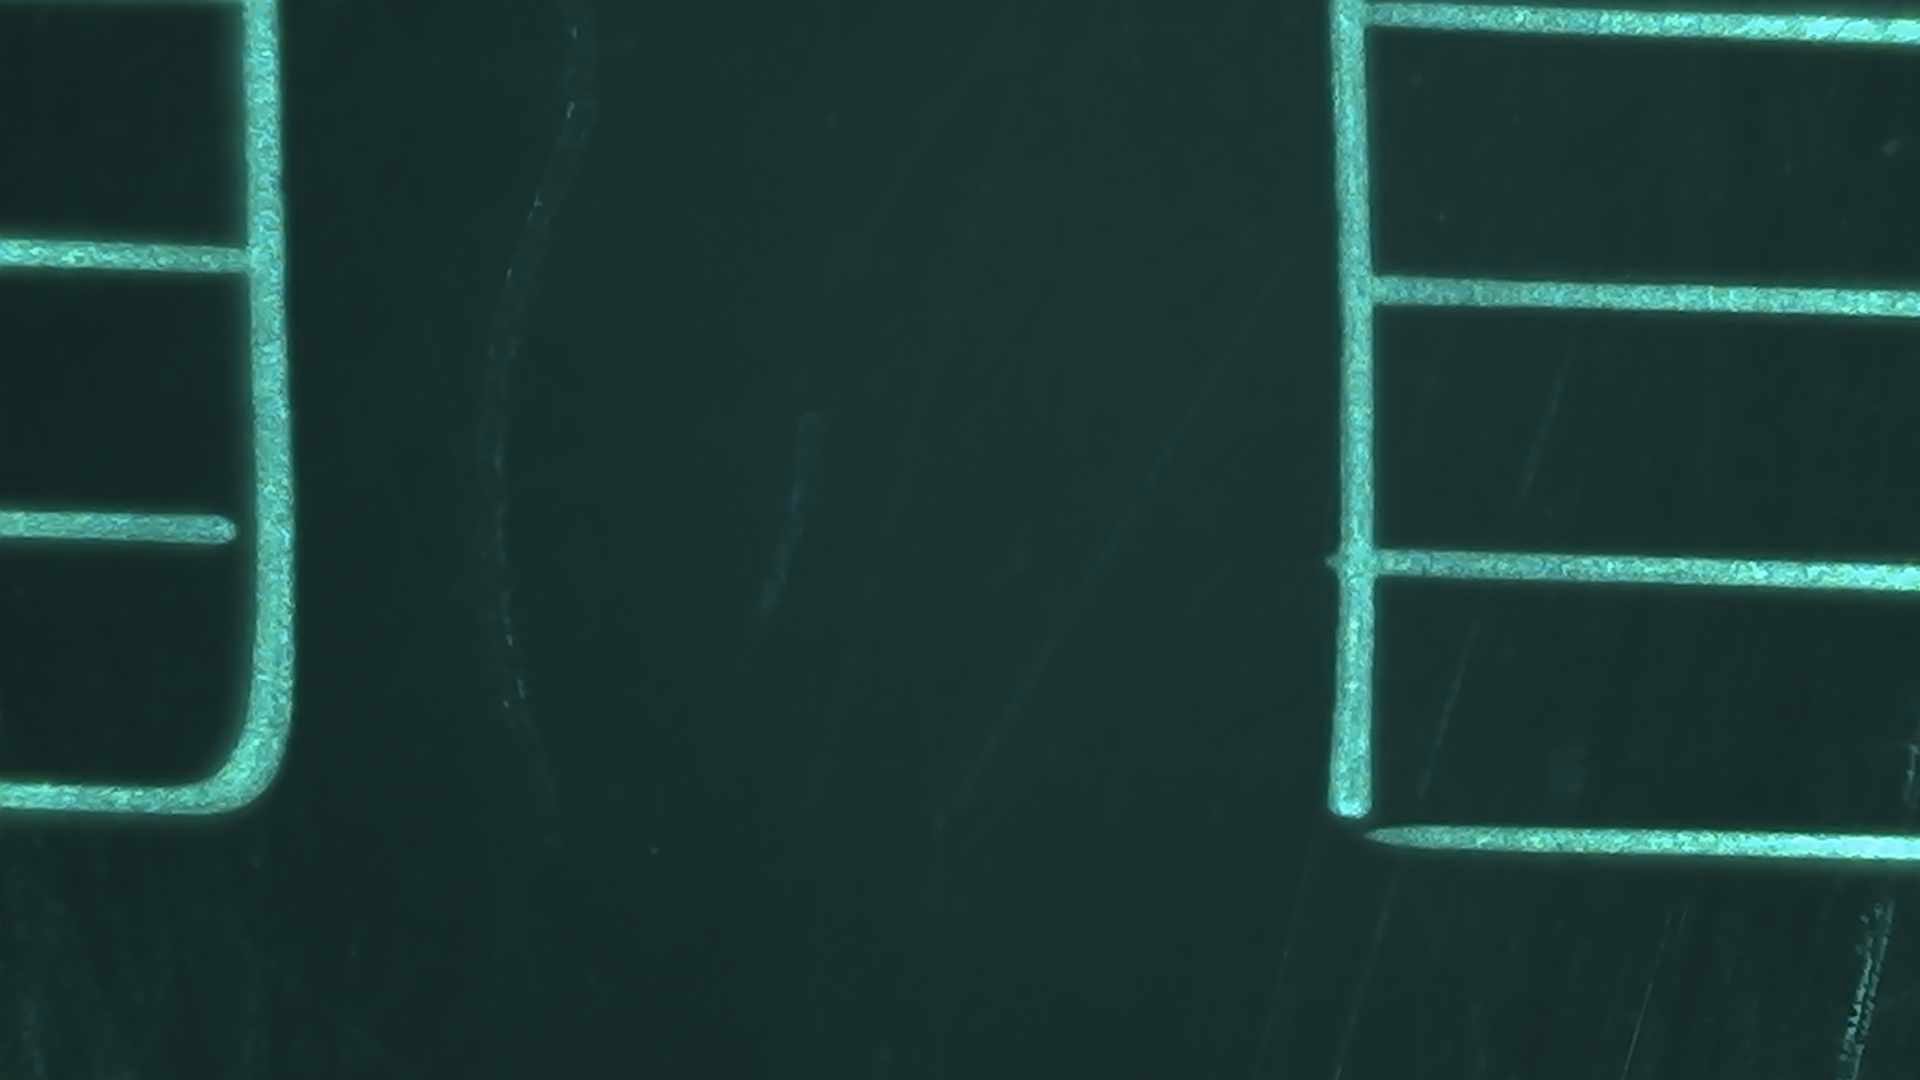
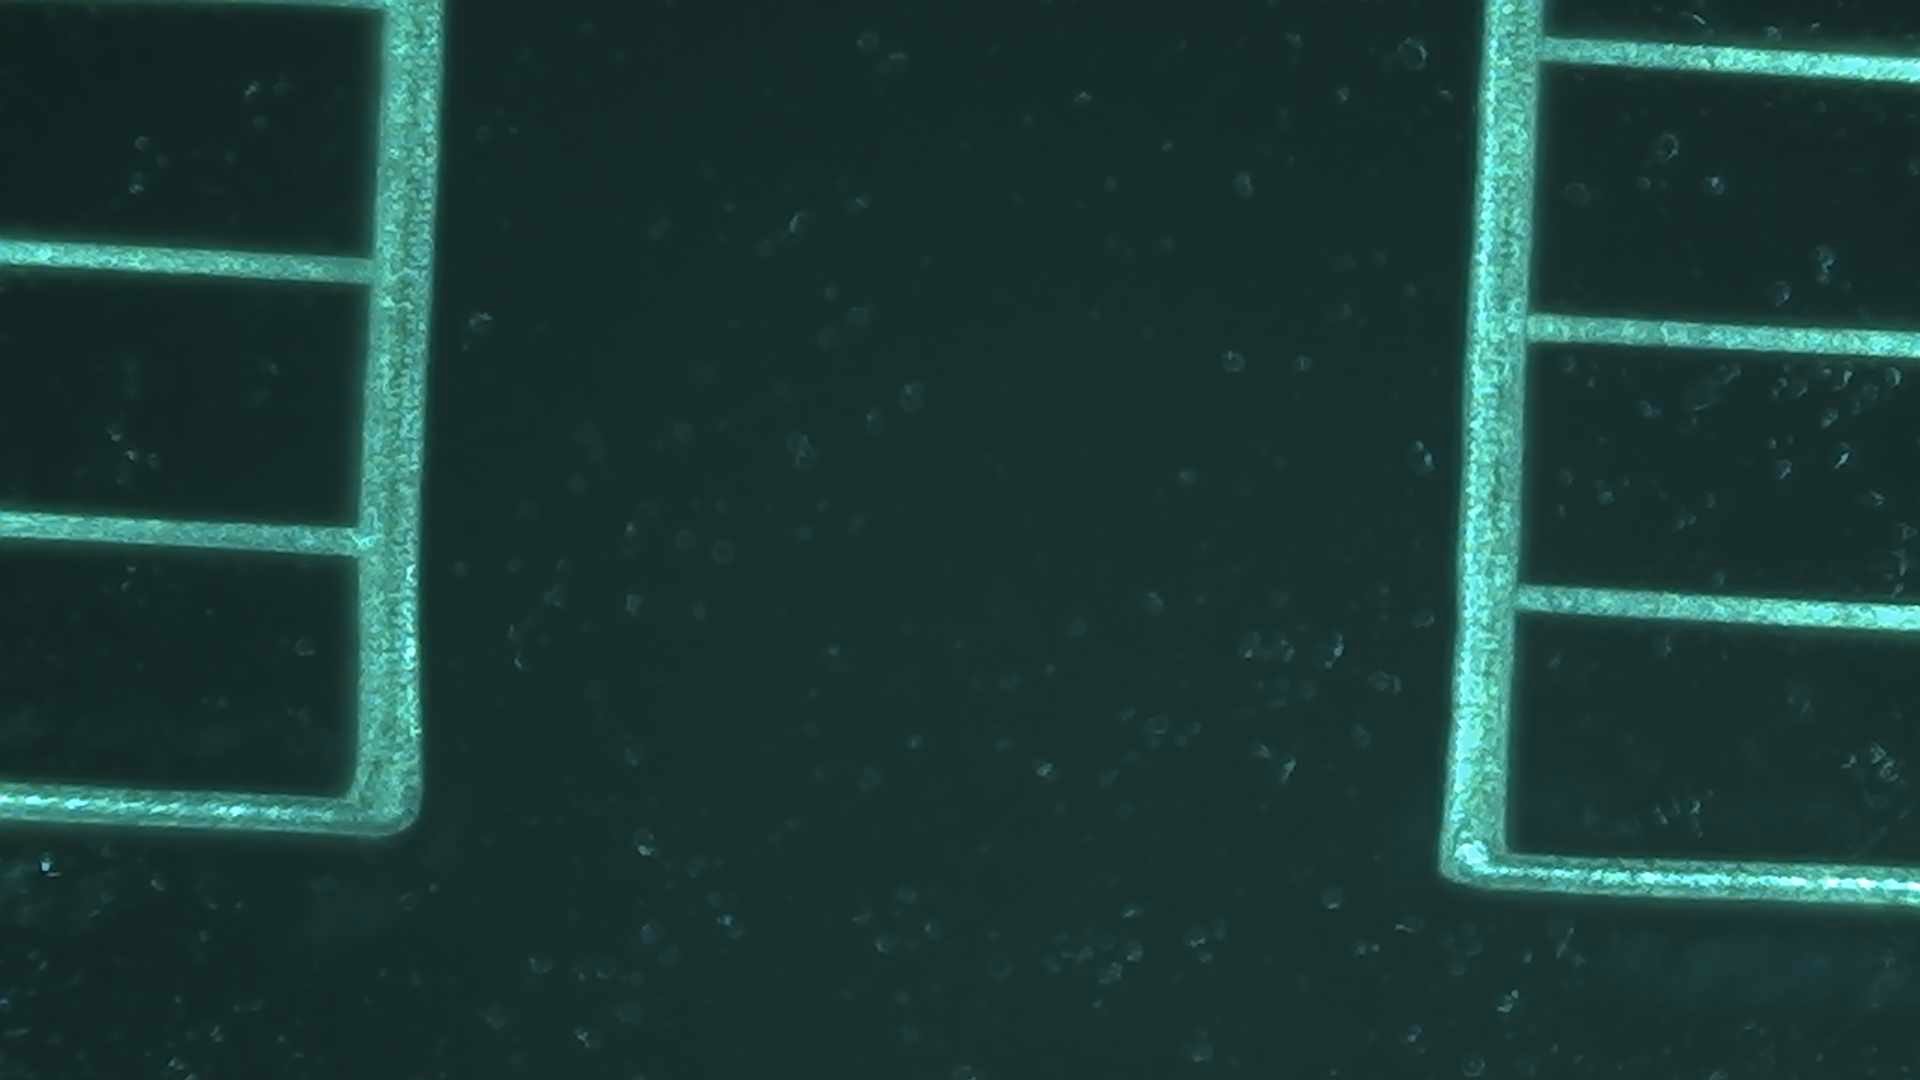
Here’s the pattern I was talking about.
I have to come to the conclusion that the guides about setting TCON/TCOFF specifically are not doing it correctly due to a fundamental misunderstanding of what it is.

It is not there to prevent overburning where it’s accelering/braking at starts/stops/corners.
It’s timing of the pulse energy vs the time framing of the XY galvo.

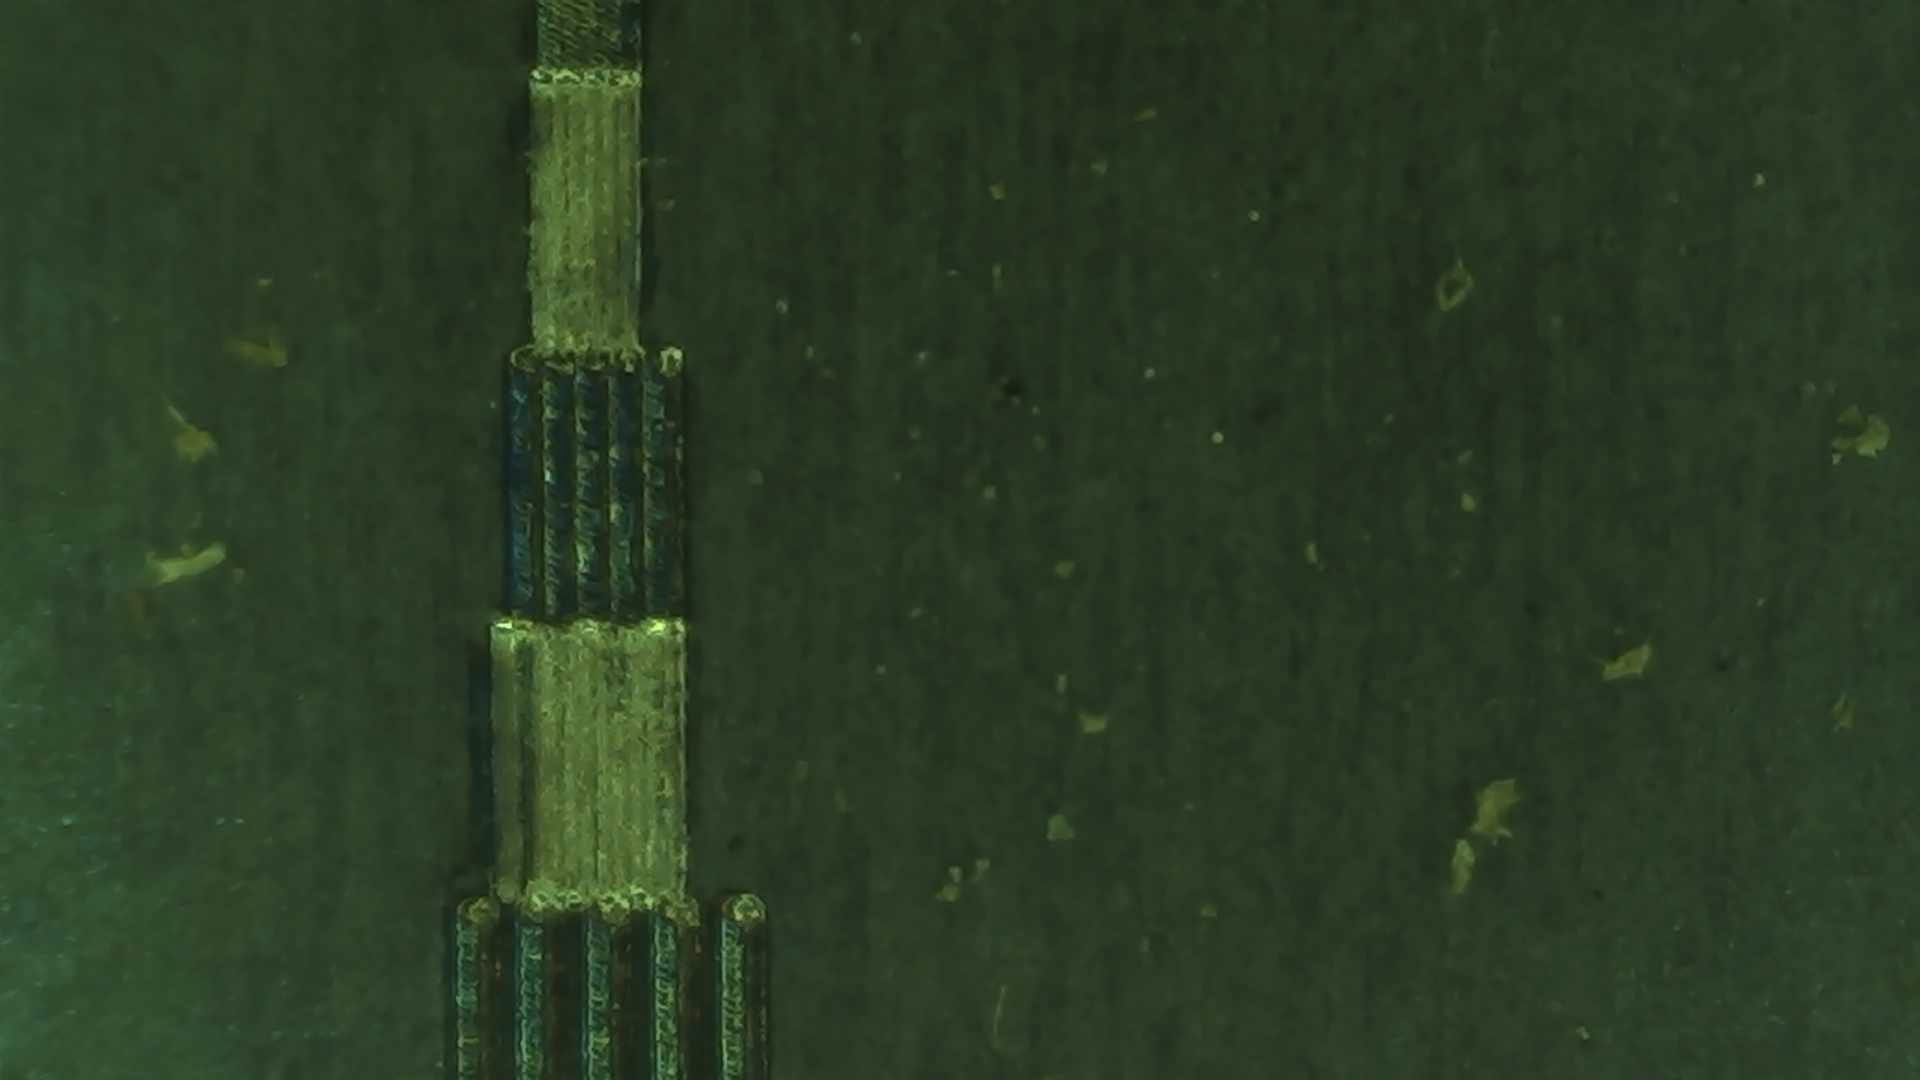
Neither LB nor EZCAD nor the BJJCZ implement overscan for the start point. For a lone linear vector, it jumps to the start point, brings the mirrors to a stop, issues a fixed-power fire command, starts accelerating down the vector, reaches the constant velocity specified in the user’s settings.
Since it doesn’t use an overscan area to speed up to the commanded speed at the start of the vector, and it can’t scale back the power while speeding up, the acceleration zone is GOING to be overburned.
The overburn is going to be deeper the faster you go. If you do “the same” burn by using 5x the speed and 5x the freq with the same q-pulse and power, the pulse delivery should in theory be the same. Raising freq and speed together mean the pulses per mm should be the same.
But the faster will see much more overburn at the start. At low speeds, the galvo may accelerate to the commanded speed before even encountering the second pulse. At high speeds and mor
Trying to compensate for this by skewing TCON would create more problems.
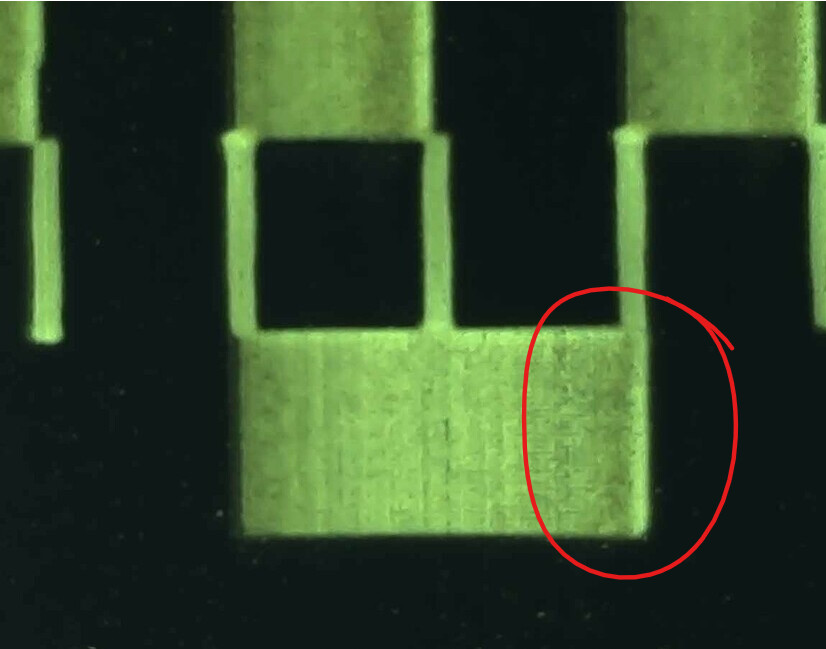
I’m unclear on exactly how it stops- I do clearly see the overburn around the start point, but the endpoint is a tail the narrows a bit. So it doesn’t look ahead and start braking before the end of the vector- not for singles. It does come to a stop (and overburns) for vectors chained together because they share endpoints (corners)
I’m not sure exactly how the BJJCZ does it trajectory planning, but clearly for single vectors it lets the mirrors scan past the endpoint and just turns off the beam when it should be passing the endpoint.

In a raster context, TCON/TCOFF shift where ALL features start and stop, not just the start/stop of the raster line. e.g. if you are rastering a bunch of 1mm dashes with the beam going left to right, increasing TCON will shift all the start points to the right. This narrows the dashes.
Increasing TCOFF shifts the stop points to the right. The dashes get longer.
If you add the same amount to both TCON and TCOFF, the entire raster line will shift to the right without distorting the dash lengths.
TCON/TCOFF is critical for all rasters that use bidir, cross hatch, or rotation. If you increase TCON to reduce the overburn on vectors, simple unidirectional rastering (graphics or fill) won’t look that bad at first, the features are just narrowed a bit by the delayed start every time it encounters something to fire for.
But once you click Bidir, then the left-going line and right-going lines do not line up. If we do a simple horizontal raster on an aligned rectangle, both left and right sides will be jagged. Some may try to fix this by using rotation, which then spreads the timing errors all over the place and it will “smooth” the edge and make it appear blurry, but generally not jagged. This isn’t the right way to do it, it will not be crisp and small features will disappear.

Also, the linear size of that error will be reduced proportionately by rastering slower. This leads to a widespread belief that the rasters are just less accurate at higher speeds, and settle for unnecessarily slow rasters. That’s not the case. The common SG7110 should be pretty accurate all the way up to 7000mm/s. Just FYI, if we go with 0.015mm as the focal spot size, at 7000mm/s is still 2us per spot size. The interesting point is the q-pulse is in nanoseconds, so the q-pulse time of even 500ns is still significantly smaller (1/4th) than a spot, so it can’t “smear” the pixels by taking too long. Also of note, the center of the energy output would only shift over by about 1/8th of a spot if you switched all the way over to a 2ns q-pulse. This explains why timing seems to be unaffected by q-pulse choice.

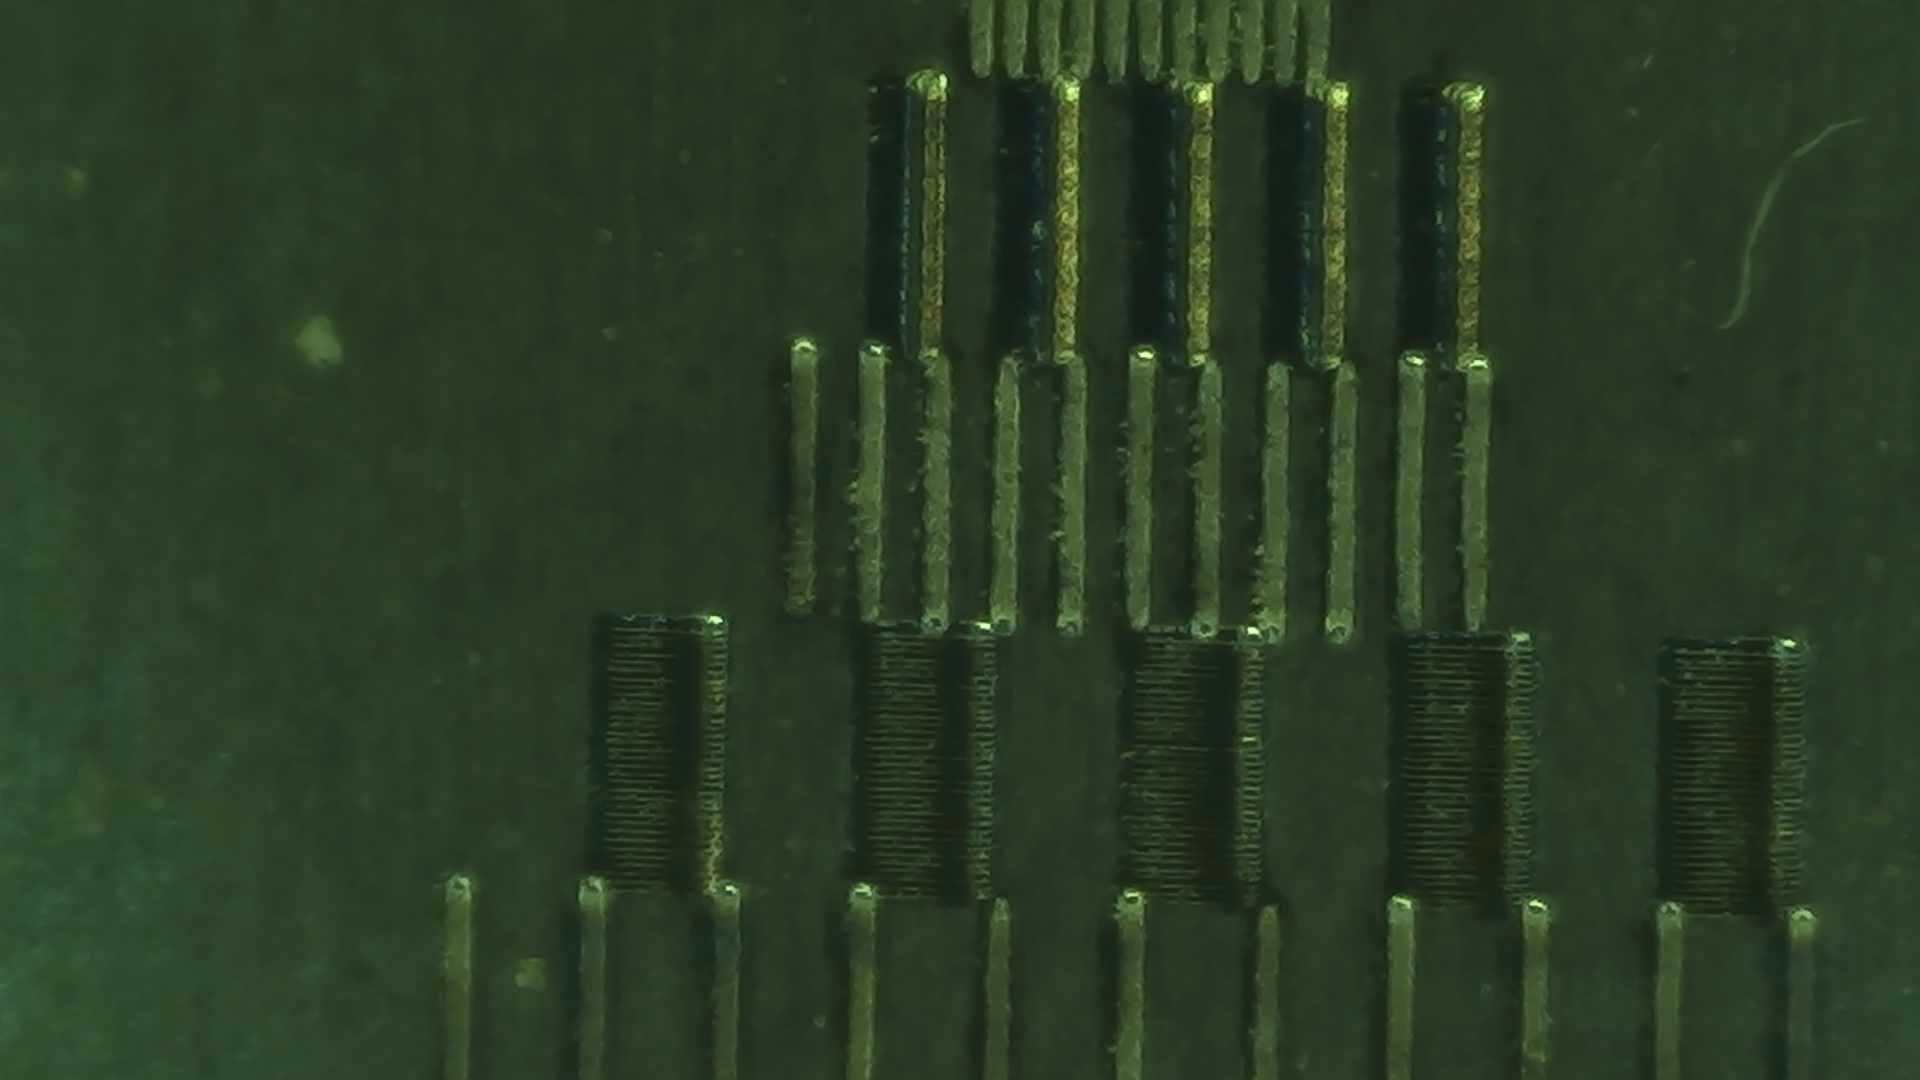
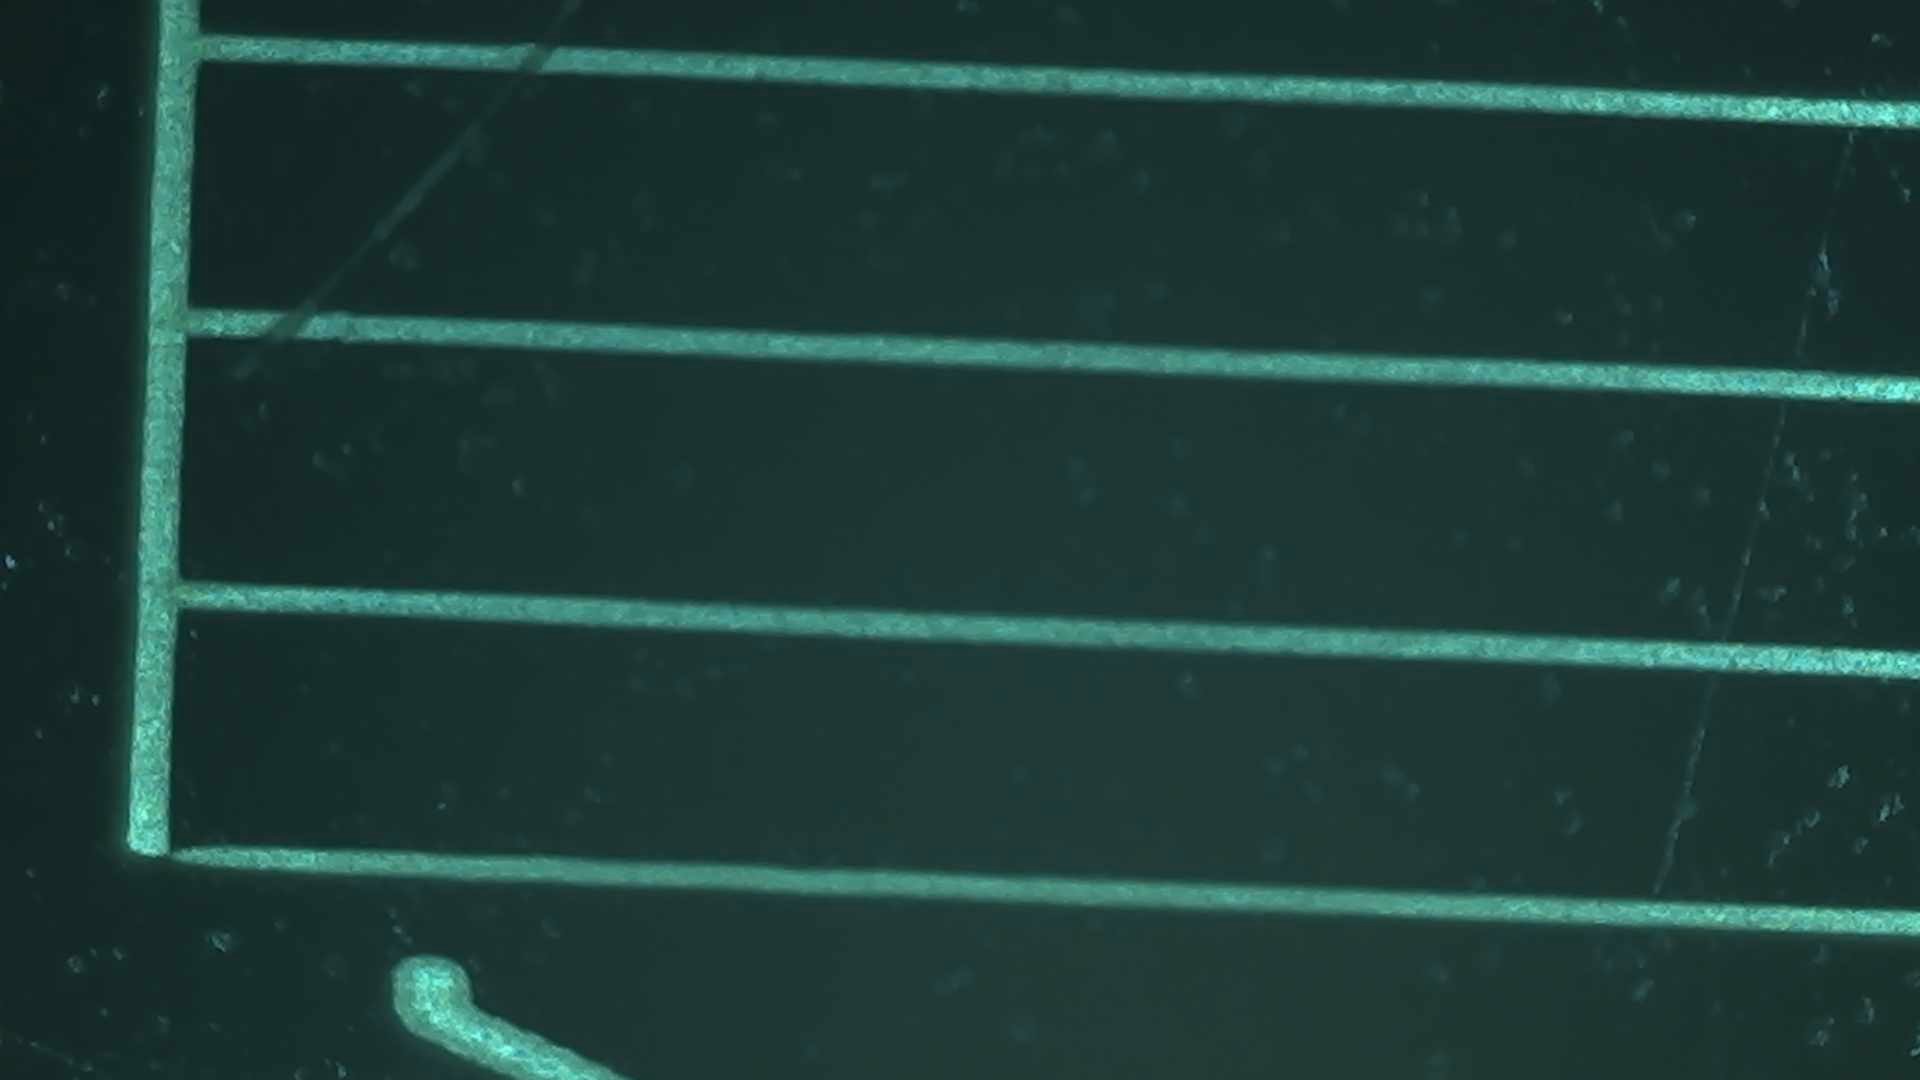
TCON/TCOFF should not be calibrated by vectors, but by raster. What I did hear is create vertical reference vector lines. It won’t matter much what is already in TCON/TCOFF, that would only shift the line’s endpoints up or down, it can’t shift them left/right. You can zero them out before starting if you want, or not.

This test takes only a tiny space, and gives an instant, objective, precise measured answer for the correct TCON/TCOFF.

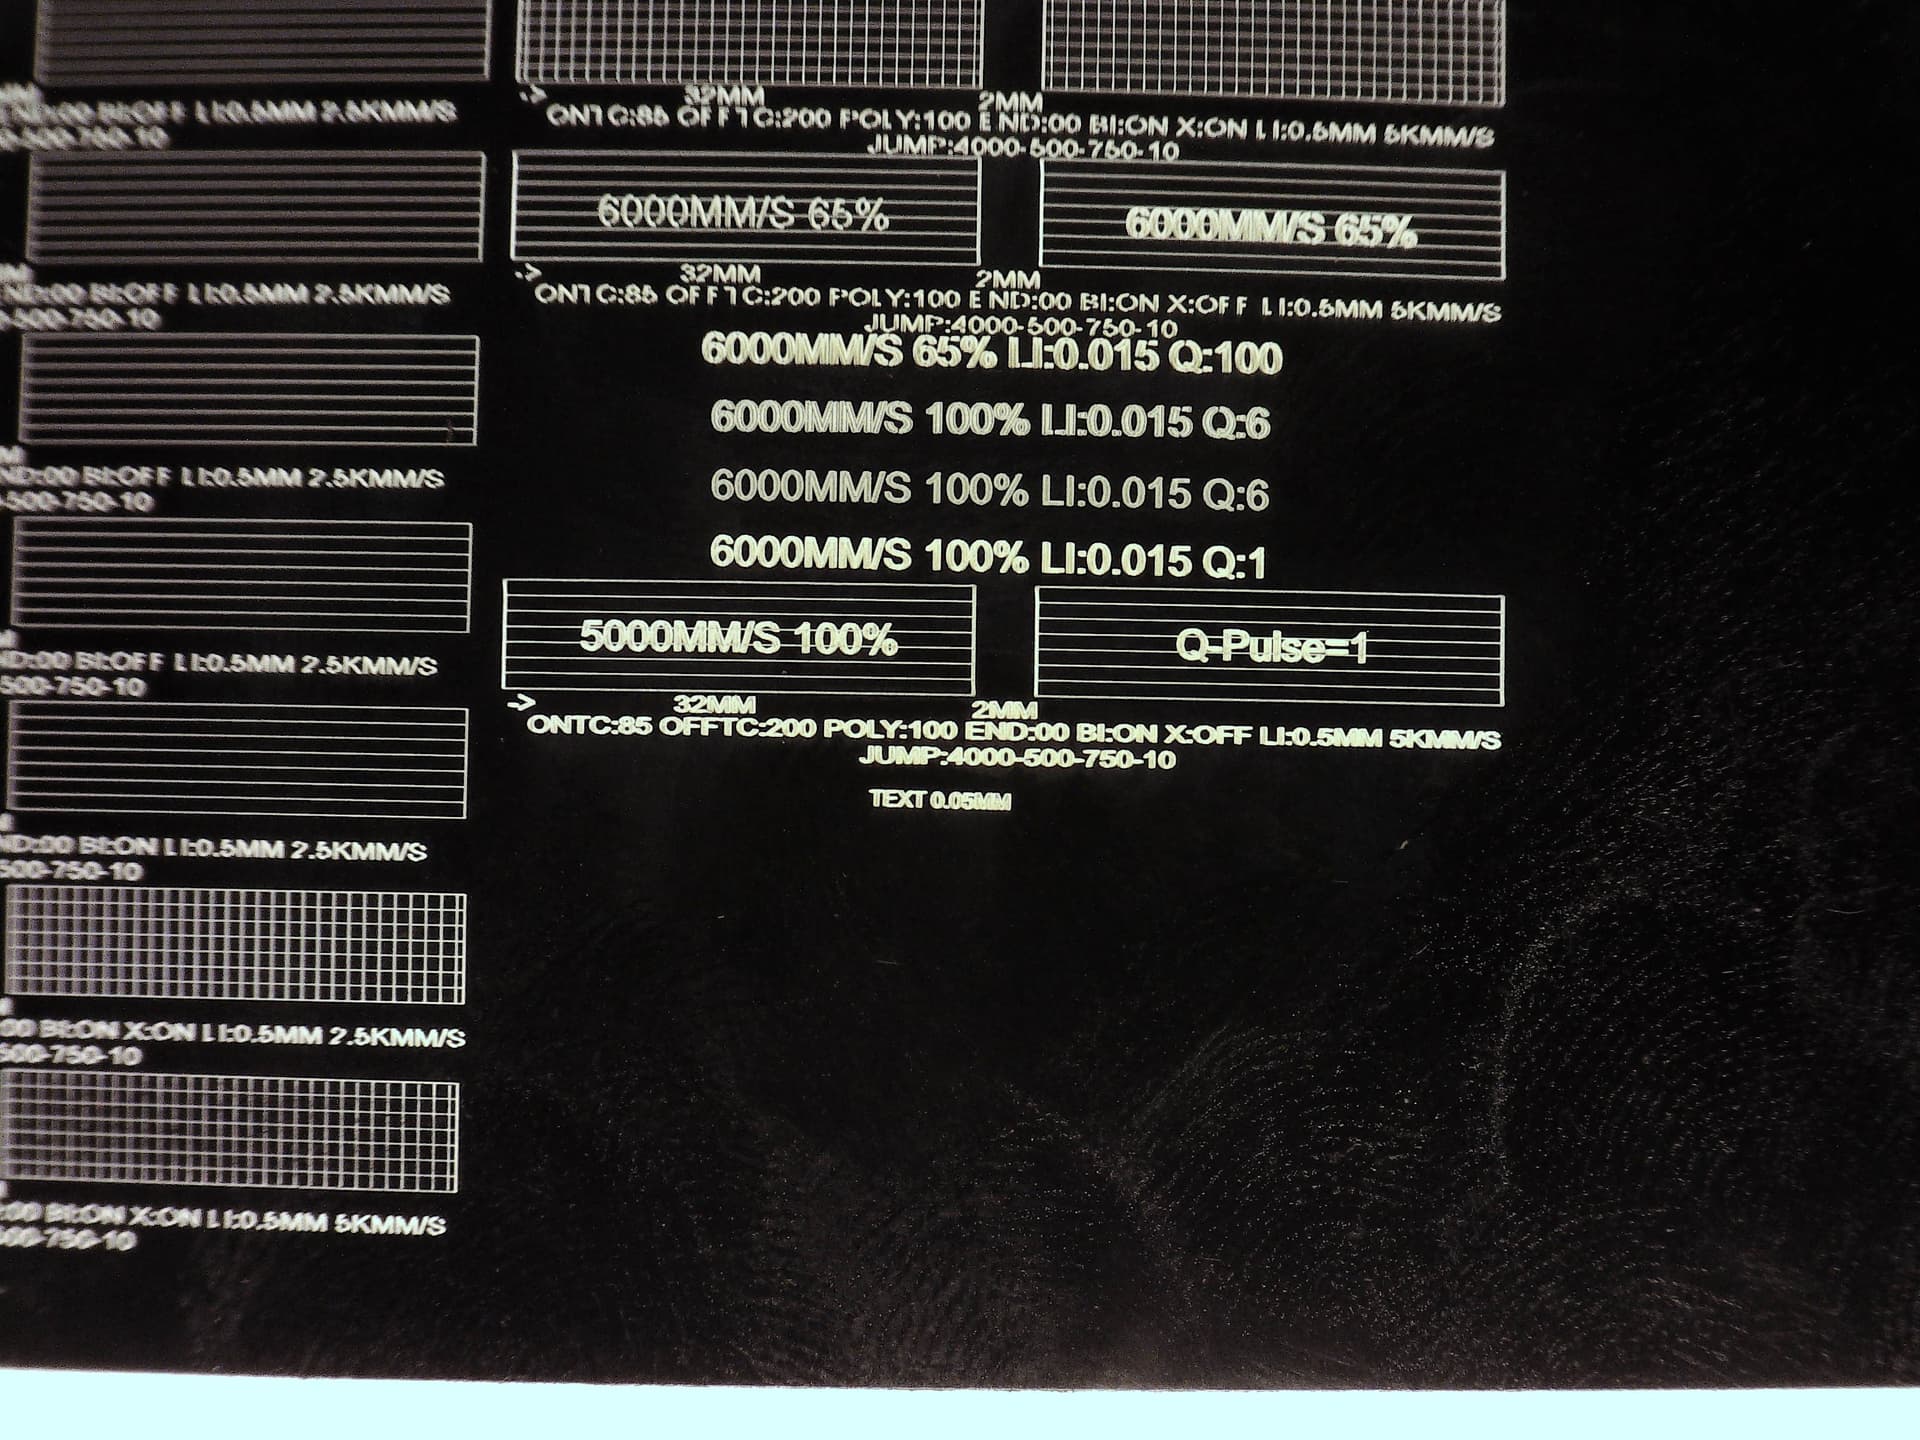
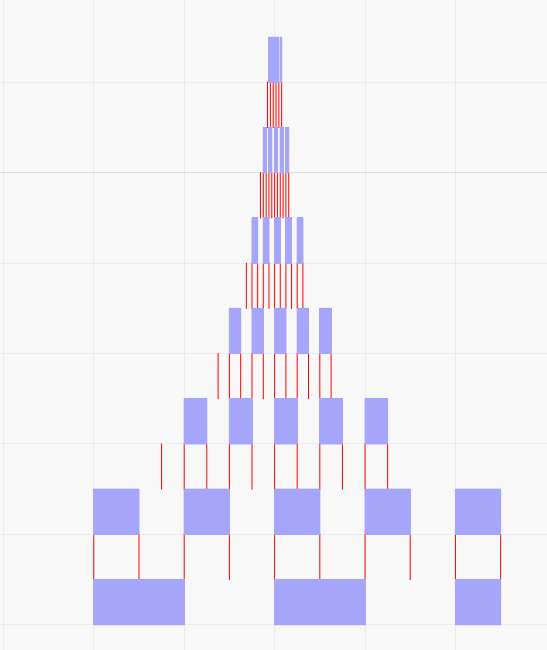
The raster must by unidirectional (not bidir), oriented horizontally, with no rotation, single pass, standard LI (probably 0.015mm for a 110mmx110mm lens), that does all the shapes at once (not individually). I use left-to-right travel. Higher raster speeds, ~3000mm/s, are best since any TC error will shift the features more measurably. I’d recommend freq=speed/LI although I didn’t follow that here.
We want want to keep the line narrow, so use the shortest q-pulse that makes a mark.

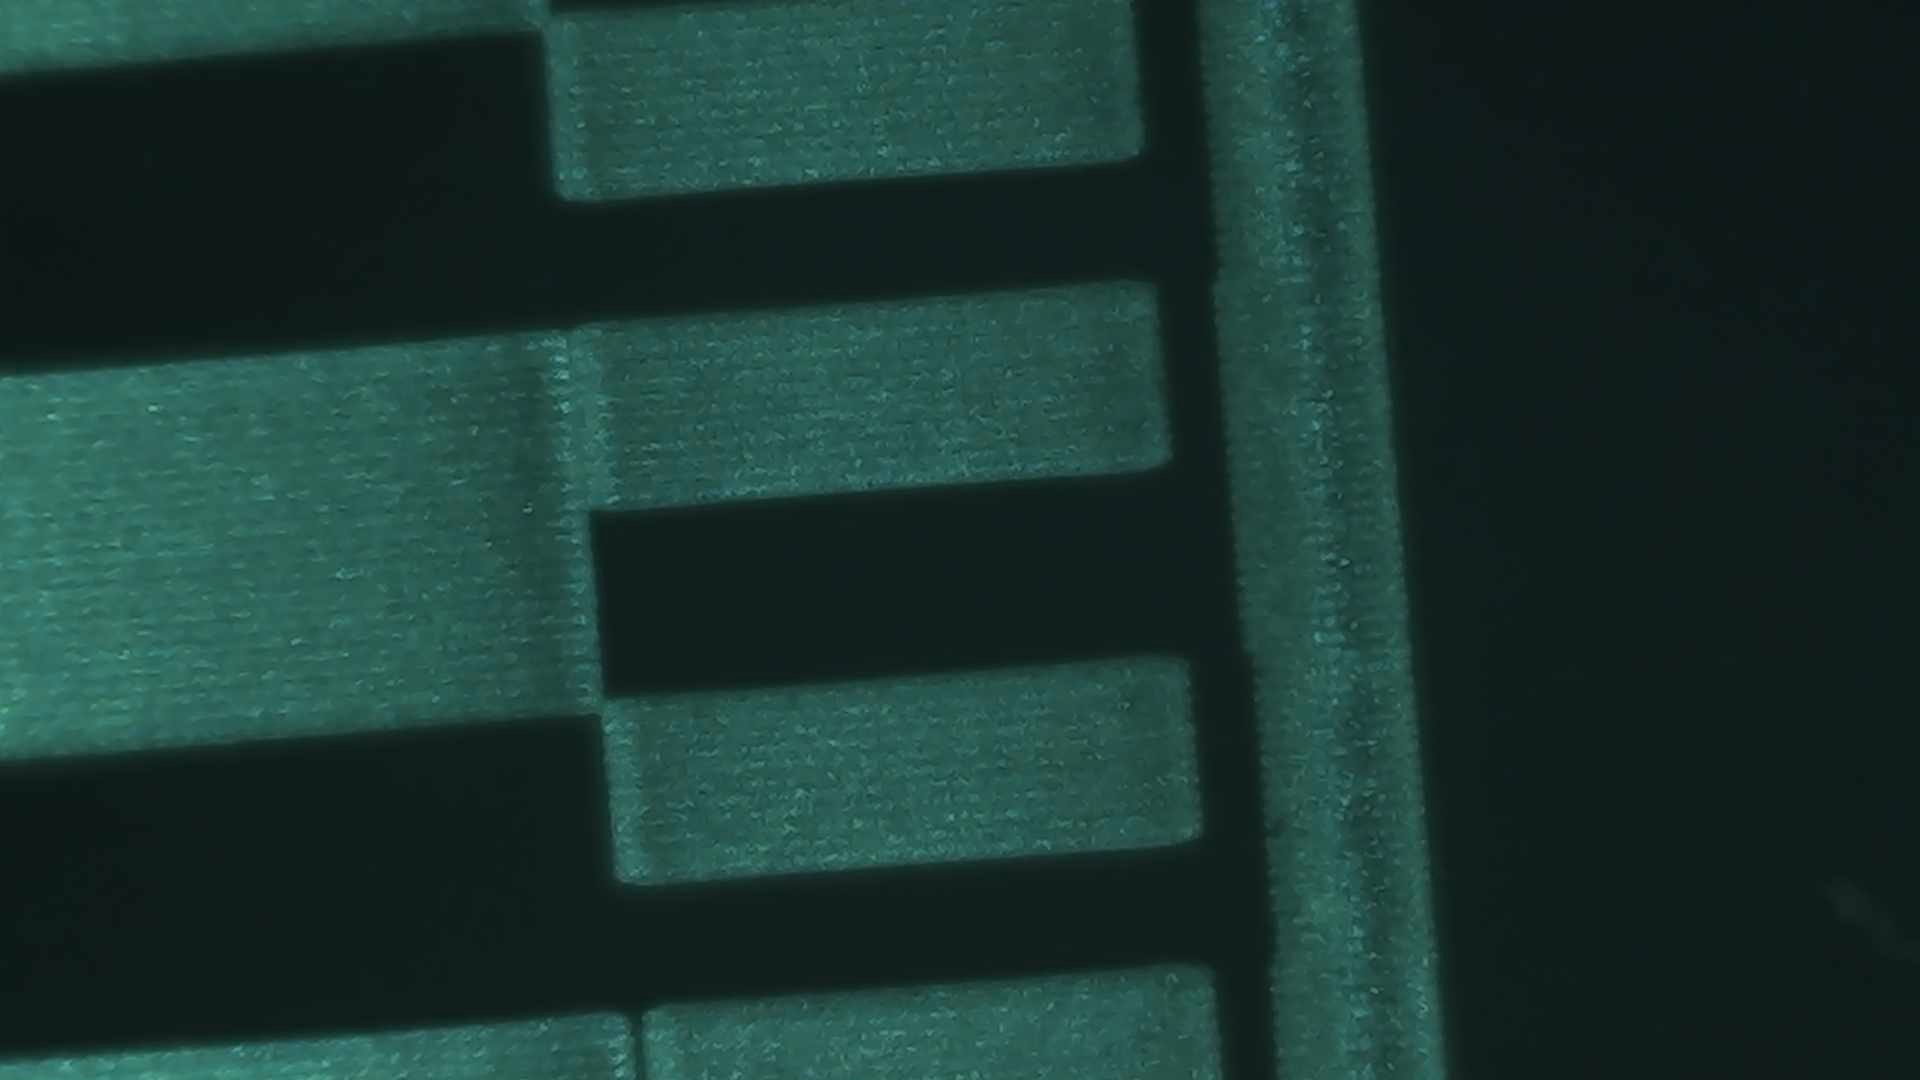
All we’re looking for is the raster rectangles line up with the tick mark- and the correct tick mark in both start and stop point. It’s fairly easy to calculate from speed, the large rectangles and the tick marks are 1mm apart and then halve over and over.
Don’t look at the leftmost or rightmost rectangle. As we’ve been discussing, there is no overscan, so the mirror is accelerating for a bit before it reaches a constant velocity at the commanded speed. This region is not what TC should be tuned for.
Example: at 3000mm/s, the left side of the rectangles is shifted one tick mark on the third row of tick marks from the bottom and the stop point is shifted right by one tick mark on the fourth row.
3000mm/s =0.000333333 sec/mm=333.3333us/mm
Ticks are mm, 0.5mm, 0.25mm, 0.125mm
Start TCON is one tick of third row=0.25mm too high.
333.333us/mm * 0.25mm= reduce TCON by 83.3us
Stop TCOFF is one 0.125mm tick too high
333.333us/mm * 0.125mm=reduce TCOFF by 41.67us.
Or, putting that together, one full tick’s correction in us is 1,000,000* 0.5^(row number-1)/(speed in mm/s).

This will make all rasters beautiful. In my testing so far, timing does not seem to vary significantly with speed or q-pulse type.


tccal.lbrn2 (25.1 KB)

1 Like

Finishing up a project and then getting into this. Read through several times. Haven’t looked closely at the file yet.
Questions:
When you say “too high” you are referring to error in mm, left to right, of the TCon or TCoff , correct? Not the actual location vertically, correct?
You use the word “Raster” that would be equivalent to “Fill”, correct? We are still dealing with vectors, or are your rectangles images?

“Ticks” are the vertical lines, correct? I don’t understand when you say “it would only shift the line’s endpoint up or down”
What are you doing about Polygon and ENDTC?
Thanks for spending your time on this, I have been working on it myself in my spare time. You are coming at it from a different direction let’s see where it leads.

Some images
Titanium 110x110 lens 50% power on the fill 15% power on the lines Didn’t change anything else.


Black cheap business cards 20% line 25% fill other settings same as above.

Fill with border Bi off and Fill with border Bi on titanium W=1.0mm H=0.5mm

Vertical scan, Bi off, Bi on

So, @Dannym , what do these results suggest?

Looks like your timing is off in the horizontal scan. But it’s confusing.

I would expect that switching to bidir could expand the boundaries. It shouldn’t be able to reduce it, because the initial one (let’s assume it’s right-going) is still there for half the passes. It might start the left-going passes too early and make a new edge further to the right, and/or might stop too late and thus make a new left edge further out. For every other line.

On the pyramid tests looks like the fills are pretty much centered in the tick lines, correct? So per that test my timing looks solid, correct?
So I had a list of questions about the test, big one is your rectangles you refer to “Rasters” The Cuts/ layers settings show a fill of vectors going left to right, 0.015 line interval. So when you say

You are, as far as I can see, still using vectors. Vectors 0.0150 apart, but no difference between those and vectors, say, 1mm apart. Please help me understand.

This was a rectangle fill, plus a sublayer line, typical of what we do setting our timing. Using your settings except I increased the LI for clarity and bi=on. Start of the polygon was bottom left moving CCW.
First line up left to right, second line up is stop. Timing on the poly shows too much delay, start looks really nice, stop had too much delay. Similar to the last titanium rectangle above post.

These two rectangles were run at the same time, with a sublayer set to line starting bottom left and moving CCW. Fill starts 1 line up left to right and bi direction =on. I reduced the delays a little for both start and stop.


The start of the polygon vector and the first vector up on the left rectangle Still show a thin start, but after jumping the gap neither one shows the thin start and the stops look good.
So what I’m seeing, and I believe you were getting at with this

I agree that start is turning it on correctly after the jump, but not at the very start. I have run into this before.
A lot to consider. A reason to get overscan, but I bet it will turn out to be a BJJCZ issue not fixable with software.
Thanks.

Centered, yes. But it looks like there is some burn-in at the end of the rectangles:


If you shorten the Laser Off TC, it should still be centered.

You should leave Bidirectional off for this test so that it only marks from left to right.

1 Like

The tick marks are a reference for horizontal distance. ton/toff does not move them horizontally

the raster (could be Fill or Image) when scanned horizontally will shift ifs left and right endpoints with tcon/tcoff. On my machine, scanning left to right, excess ton shifts the left side (start point) to the left and excess toff shifts the right edge (stop point) to the right.

So if the left edge is left of the left tick mark, needs more ton. Other direction, needs less.

If the right edge is to the left of the right tick, it needs more toff.

1 Like

Understand. On the first row the TCOFF was to the edge of the tic mark, but on the next row up they centered up. I did end up reducing the delay a little as you point out. Getting pretty close.

New test:

The red is right-going raster, blue is left-going. So they make an error appear twice as wide. Each row has a calibrated overlap or gap that would make them line up on that row if the overlap or gap is equal to the timing error’s distance.

Left gap is TON, right is TOFF.

You find the row with the closest to no gap or overlap, like this:

Find the row where the left ON gap looks closest, and note the signed row number.

Say TON was 50, SPEED was 7000, and it’s labeled “/-16”
Then use this equation to determine the correction:
(new TON)=(old TON)+(1,000,000/SPEED)/(ROW)
(new TON)=50+(1,000,000/7,000)/(-16)
=50-8.92
=41

The closest row will likely be different for TON and TOFF. Iterate both each time.
If you have reached 0, stop iterating that parameter.
The correction should decrease by at least one row each time, so you should be at the zero row in at most 8 iterations.

If it’s not meeting up on any row, reduce speed by say a factor of 4 on red and blue layers and run to get it “ballpark”

I think I’m seeing that changing JUMP DELAY is having an effect here- if you change it, you need to change TON by the same amount. I’m not sure how this works. JUMP SPEED is having a stronger effect on net runtime for rasters (Fill or Image) than it should, whereas increasing the JUMP DELAYs only had a small effect.

tcon_tcoff_test_v02.lbrn2 (1.9 MB)

New methods to calibrate laser!
The TCON/TCOFF calibration method is a game changer

First off, check out the upper logboolean patterns. The “XOR” checkerboard is the most important by far and will help you understand every aspect that affects the ultimate detail level possible.

Explanatory text in-file. The right/topmost column of LINE is 1mm. Every 4 line/gap steps, the width halves, until the leftmost is 1/16th mm (0.063mm). There is a fatter buffer line to the left for consistency- the 1/16th mm white space gap on the left needs a feature on the other side.
To help you count, the bar on bottom has an edge every 4 steps, where the widths halve.
The width of each line is:
1mm*0.5^(step/4)
You can rotate 90 deg or 45 deg to vary what it’s testing

This was mirrored on an imaginary diagonal line and the boolean functions applied.

OR leaves vertical and horizontal rectangles. These leave positive features (remember, black is cut). There is technically no limit of how accurate detail can go around this sort of positive feature. However, detail most often requires negative features, and optimizations which improve pos detail won’t improve on the neg limit, and can even make it worse.

AND makes negative features. The primary limit on negative features is the “spot size”, the minimum size of burn the laser will focus to. The lens’ focal spot size determined by the diffraction rules of physics. Wavelength and incident source beam dia go into the equation, but they are constant for a given machine. All fiber lasers use the same wavelength, and most use the same 10mm source beam dia too.

Although the energy is focused into the spot, it’s not that straightforward what the mark diameter will be. The energy is strongest in the center. If the pulse energy is barely high enough to mark the surface, it could be that it will only mark in the center of the spot. Or it could be powerful enough to blast out a crater larger than the spot itself

That leaves lens focal length as the only true variable. In galvos we often describe a lens size by the bed size it creates. F100 produces a 110mmx110 and I get a mark 0.015-0.030mm in dia. A 300x300 lens would be 0.040-0.080 mm. Energy density goes down by a factor of (1/2.72)^2

XOR is the most useful pattern. It is very clear when the corners don’t line up and meet at a point. The horizontal and vertical detail are two different things, and this shows both.

The lower set of logarithms is graded differently, it halves from 1mm only once in 16 steps. If you use the first test to get an approx range where the detail doesn’t work, this will help get a more exact number

You can scale these to a different size too. You can also do Convert to Bitmap too so you can burn as Image, although this seems to produce the same results as Fill so far
LogarithmicBooleanEyeChart10.lbrn2 (2.1 MB)