I decided to burn a grid into my spoil board. First, because it looks convenient, second, because it will help me learn some of the software (GRBL - LightBurn Pro 2.0.0.4, windows 11).
I wanted to be fancy and have it put the coordinates in automatically but have run into trouble with the incrementing of the variables. This is how I went about it:
And you see, I learned something about the software or really how I think about it. I need to integrate the idea of different passes for different tasks into my planning.
Welcome! I think you will find it does not take much longer and the design phase will go a lot quicker. The real advantage is that you have to fix something on one layer, it will not screw up the other layers.
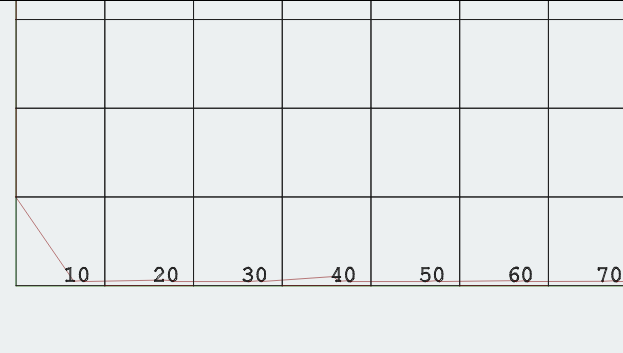
I tried to implement your suggestion but I likely misunderstood. I can’t attach the CSV I’m using (see the postscript) but it just runs from 10-290 down column A (rows 0-28).
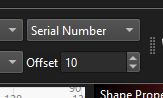
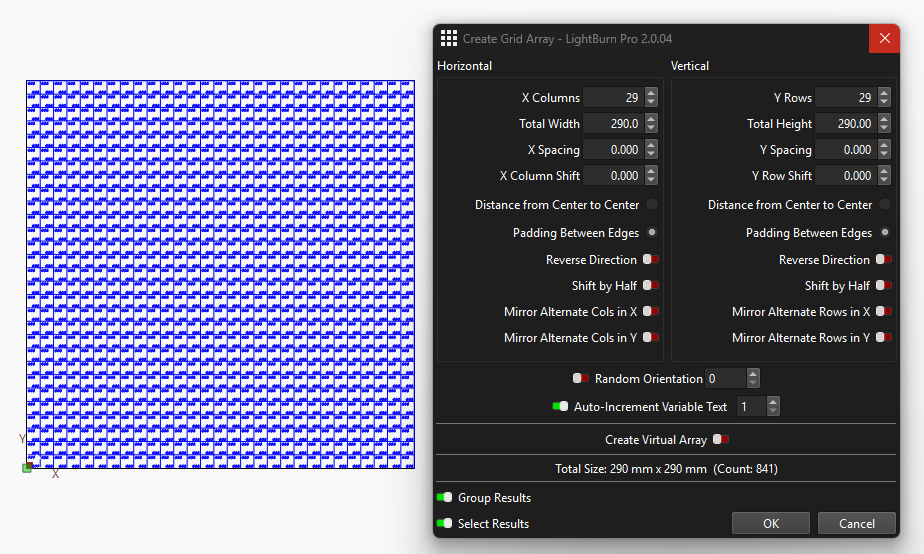
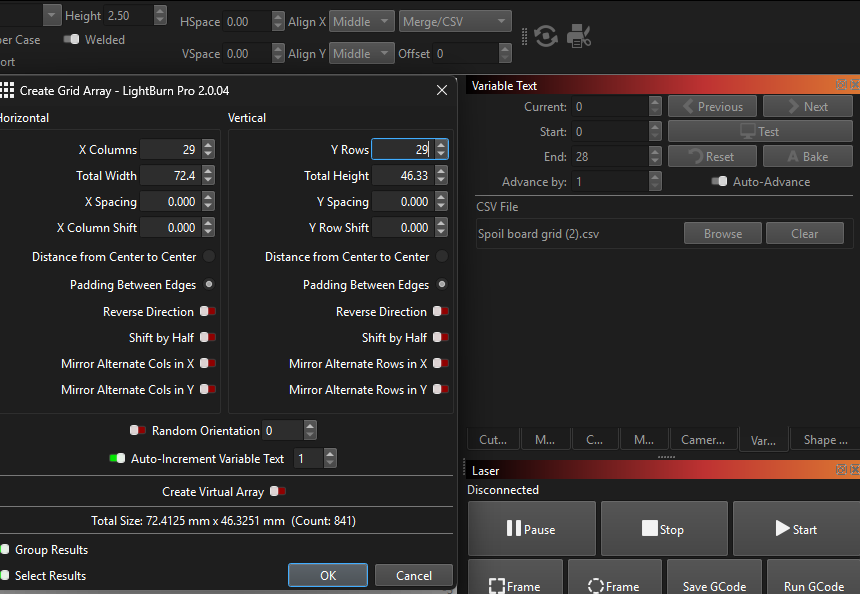
Here’s my array and variable setup…
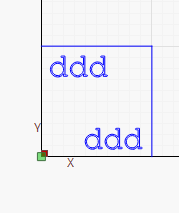
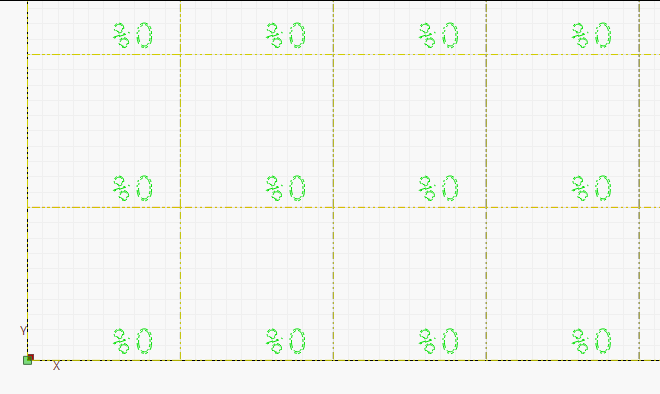
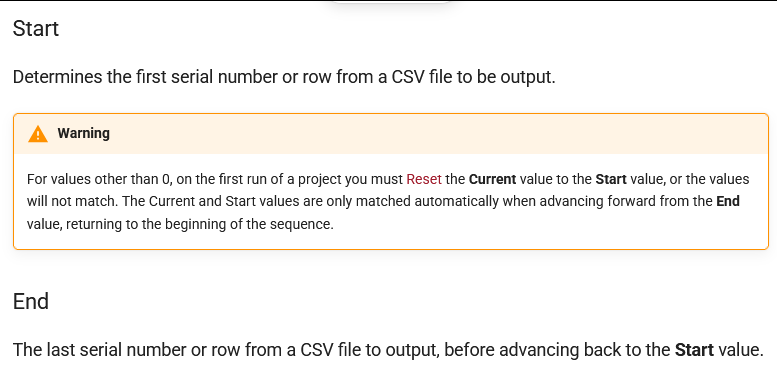
From the documentation, I thought the current index/row/serial was supposed to cycle from the Start index to the End index and then return to Start. I assumed that meant it would cycle so I expected to the see the same 29 values repeated row on row as the array goes upwards but instead it’s blank after the first row. This also happens when I click the Test button. What did I miss?
P.S. Just as a funny side note, the forum wouldn’t let me post this reply because it found a bad word. Turns out, the bad word was part of the random string generated for the filename of the CSV I tried to upload. Even changing the filename wouldn’t change the string.
The auto increment will go from %28 to %29. If there’s only 29 values in the csv, %29 will be blank (0 indexing) You can copy the 0-28th row into the 29-58th in the csv and you should see the 2nd row populate in light burn. 28 more times and your good to go!
I’m starting to wonder if I hallucinated the documentation but I was sure I found something that said it goes back to the start on its own but now I can’t find the page…
I’m afraid adding the .txt extension to the CSV did not change the bad word generated in its hosted named. Here is the content pasted:
10
20
30
40
50
60
70
80
90
100
110
120
130
140
150
160
170
180
190
200
210
220
230
240
250
260
270
280
290
I recognize that duplicating in a spreadsheet is significantly easier than doing each number by hand and would still save a huge amount of time and effort but I’m curious if Lightburn won’t do it in a loop on its own.
It appears there’s some kind of hash involved because changing the filename completely didn’t make a difference but adding one extra bit of data inside the file made it work.
I see that. That should have not made any difference at all.
Your LBRN file was looking for “(2)” in the filename. The CSV you sent did not have it. Once I duplicated your directory where the CSV was located, I got the LBRN file to load without an error message.
To my surprise, there were no squares or variables in it. Nothing but a link to the CSV file.
And I just hit my 5 posts in the first day maximum, hopefully an edit will sneak past, but don’t expect me to have anything more to say today.
Looks like I just didn’t save anything I did, I was pretty tired, so I redid it just now with the same results so you’re still roped in. Spoil board grid.lbrn2 (3.7 MB)
If I got it right, you need to increment horizontally bottom to top for X and vertically left to right for Y. I am guessing that is not possible in a single run. Which takes me back to doing it in separate layers.
I did get the file with stuff in it this time. How do you keep up with these versions? CSV is now in a different folder, which I had to create.
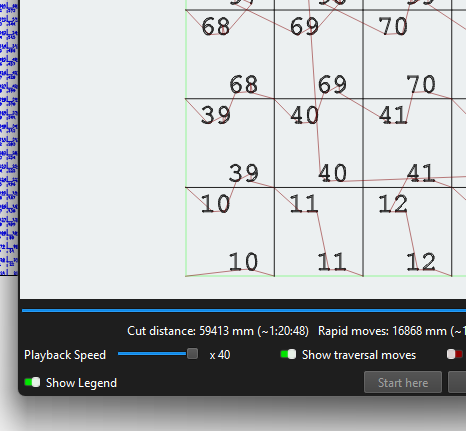
I sorted it out, and you are not going to like the answer. Once I understood clearly what you are trying to accomplish, I went into the research mode. Variable text apparently does not wrap columns. But if you put in a second set of numbers in the CSV, it will populate the next row. Two down and 27 to go.
I uploaded the new CSV file to illustrate what I did. Link to it and you will see the second row in Preview. I also uploaded a couple of PDF files. Remove the .txt extension to view them.
To get the Yaxis numbers, add a %1 variable to the grid and populate the CSV cells with the appropriate Yaxis values. You will then have a set of XY pairs for each cell. If you think about it, you may not be able to duplicate the first 29 rows in the CSV due to a different number pattern in the Y numbers.