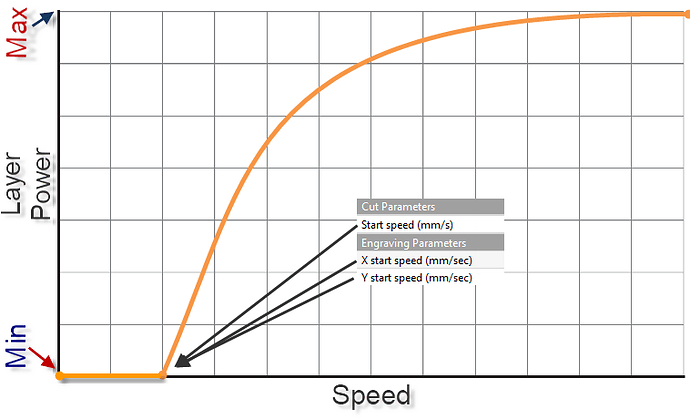
On a Ruida controller (for example) the power curve representing how min and max power function relative to speed, if it were drawn, might look something like this:
What is important to note about this is the configuration of the controller allows for setting the start speeds (either for Line Layers or for Fill / Engrave layers). The start speed is speed at which Min Power value is used on a layer.
Any movement on a layer at or below the configured Start Speed Parameter in the controller will have the min power value applied during laser on. Any movement on the layer above the configured Start Speed Parameter in the controller will have such a curve applied to it.
So with that, also consider the controller may allow for setting the Acceleration (the rate at which speed increases) and E Stop Acceleration (the rate at which speed decreases to change directions in a cut or engraving). These values affect the slope of that curve. And, to make it more interesting  Some controllers (like the Ruida) allow the configuration of those acceleration settings independent to the layer type.
