I figured this wouldn’t take very long to verify my hunch, so I quickly coded up a test, and here’s the result:

Image on the right is the original code, and image on the left is the modified code.
Now here’s the fun part:

The image is the middle is running the same code as the one on the right, I just set the speed to sane value that the board could actually keep up with. (in this case, I used 100mm/sec, which is about what I measured the other code doing)
In one of your images above, you posted these settings:
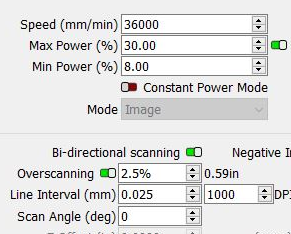
36000 mm/min is 600 mm/sec. Using an interval of 0.025mm, that would be 24000 pixels per second, and each pixel needs a “set power” and “line to” command, so that’s 48000 commands per second that the board has to process.
It appears that the hardware limit is much lower, particularly for the “set power” commands. So, merely setting the speed to something the board is capable of processing “fixes” the issue.
All my new code does is output a “set power” and “draw line” command for every single pixel in grayscale mode, instead of trying to produce less data by sending out longer runs when all the pixels are the same.
So, it’s not really a bug, you’re asking the hardware to exceed its abilities, and the EZCad2 software gets around the problem by simply masking it, and forcing the board to run at the same slow speed for the whole image.
I knew this had the potential to be an issue, but coded it the way I did because I figured you could just request a lower speed to fix the problem (which I’ve now verified), and the way EZCad does it consumes a lot more memory.
So you said, “I bet the problem isn’t with my files…”, but it kind of is - You’re requesting a speed that the hardware isn’t capable of. If you reduce your speed to 100mm/sec (6000mm/min) I’m betting the problem is no longer visible.